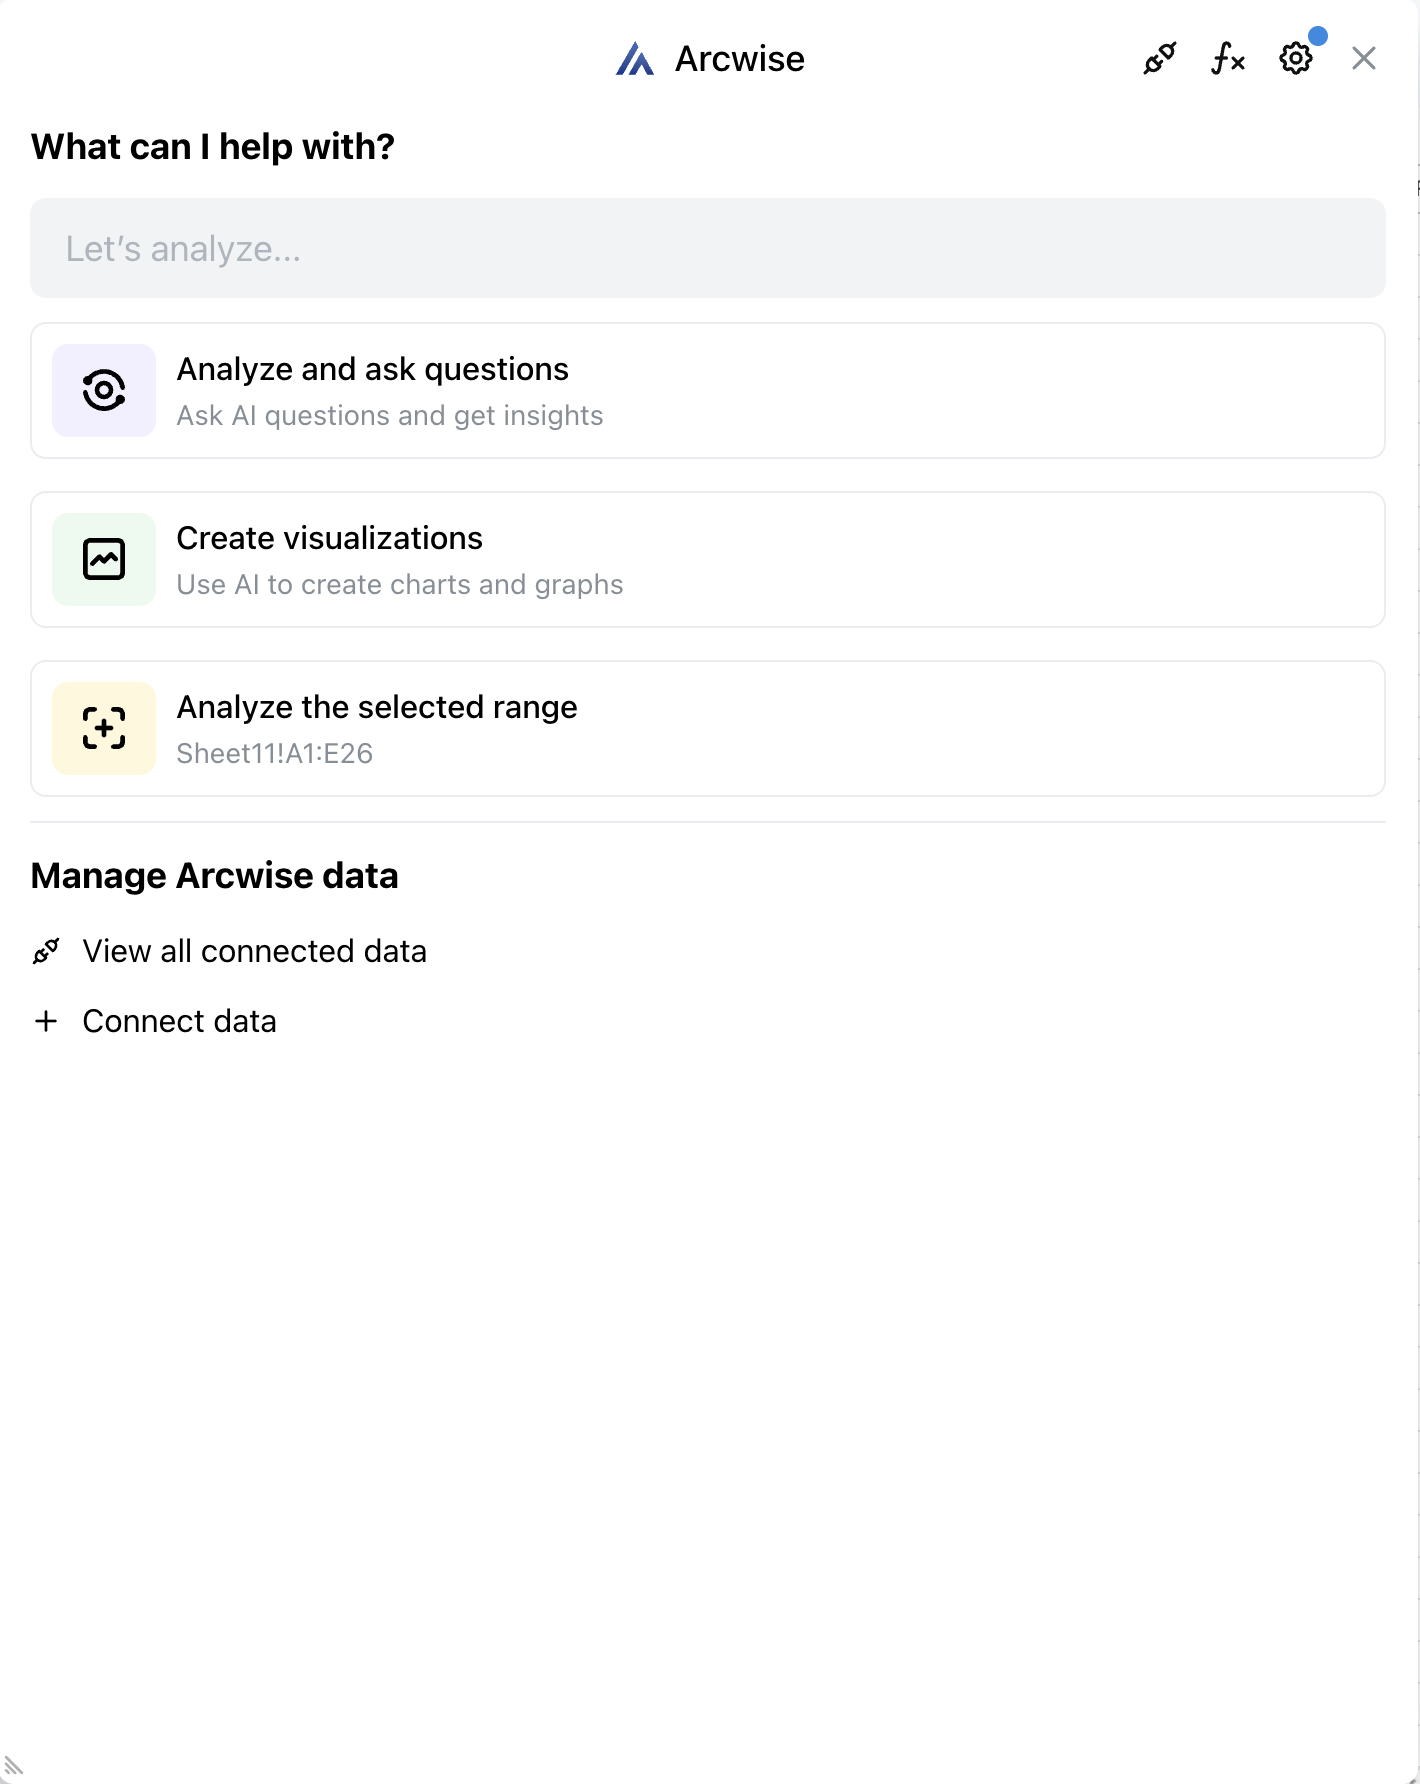
# Welcome to Arcwise!

Arcwise is an AI first data analysis and reporting platform with a deep integration with Google Sheets. To get started right away add our [Chrome Extension](https://chrome.google.com/webstore/detail/arcwise/gcambpmifmpmaenjfjlelhpmelbinnil).

With Arcwise you can:

* Connect data from your data warehouse and favorite tools: [Connecting data](/connecting-data/connecting-data)
* Work with large data: [Working With Large Data](/using-arcwise-in-sheets/working-with-large-data)
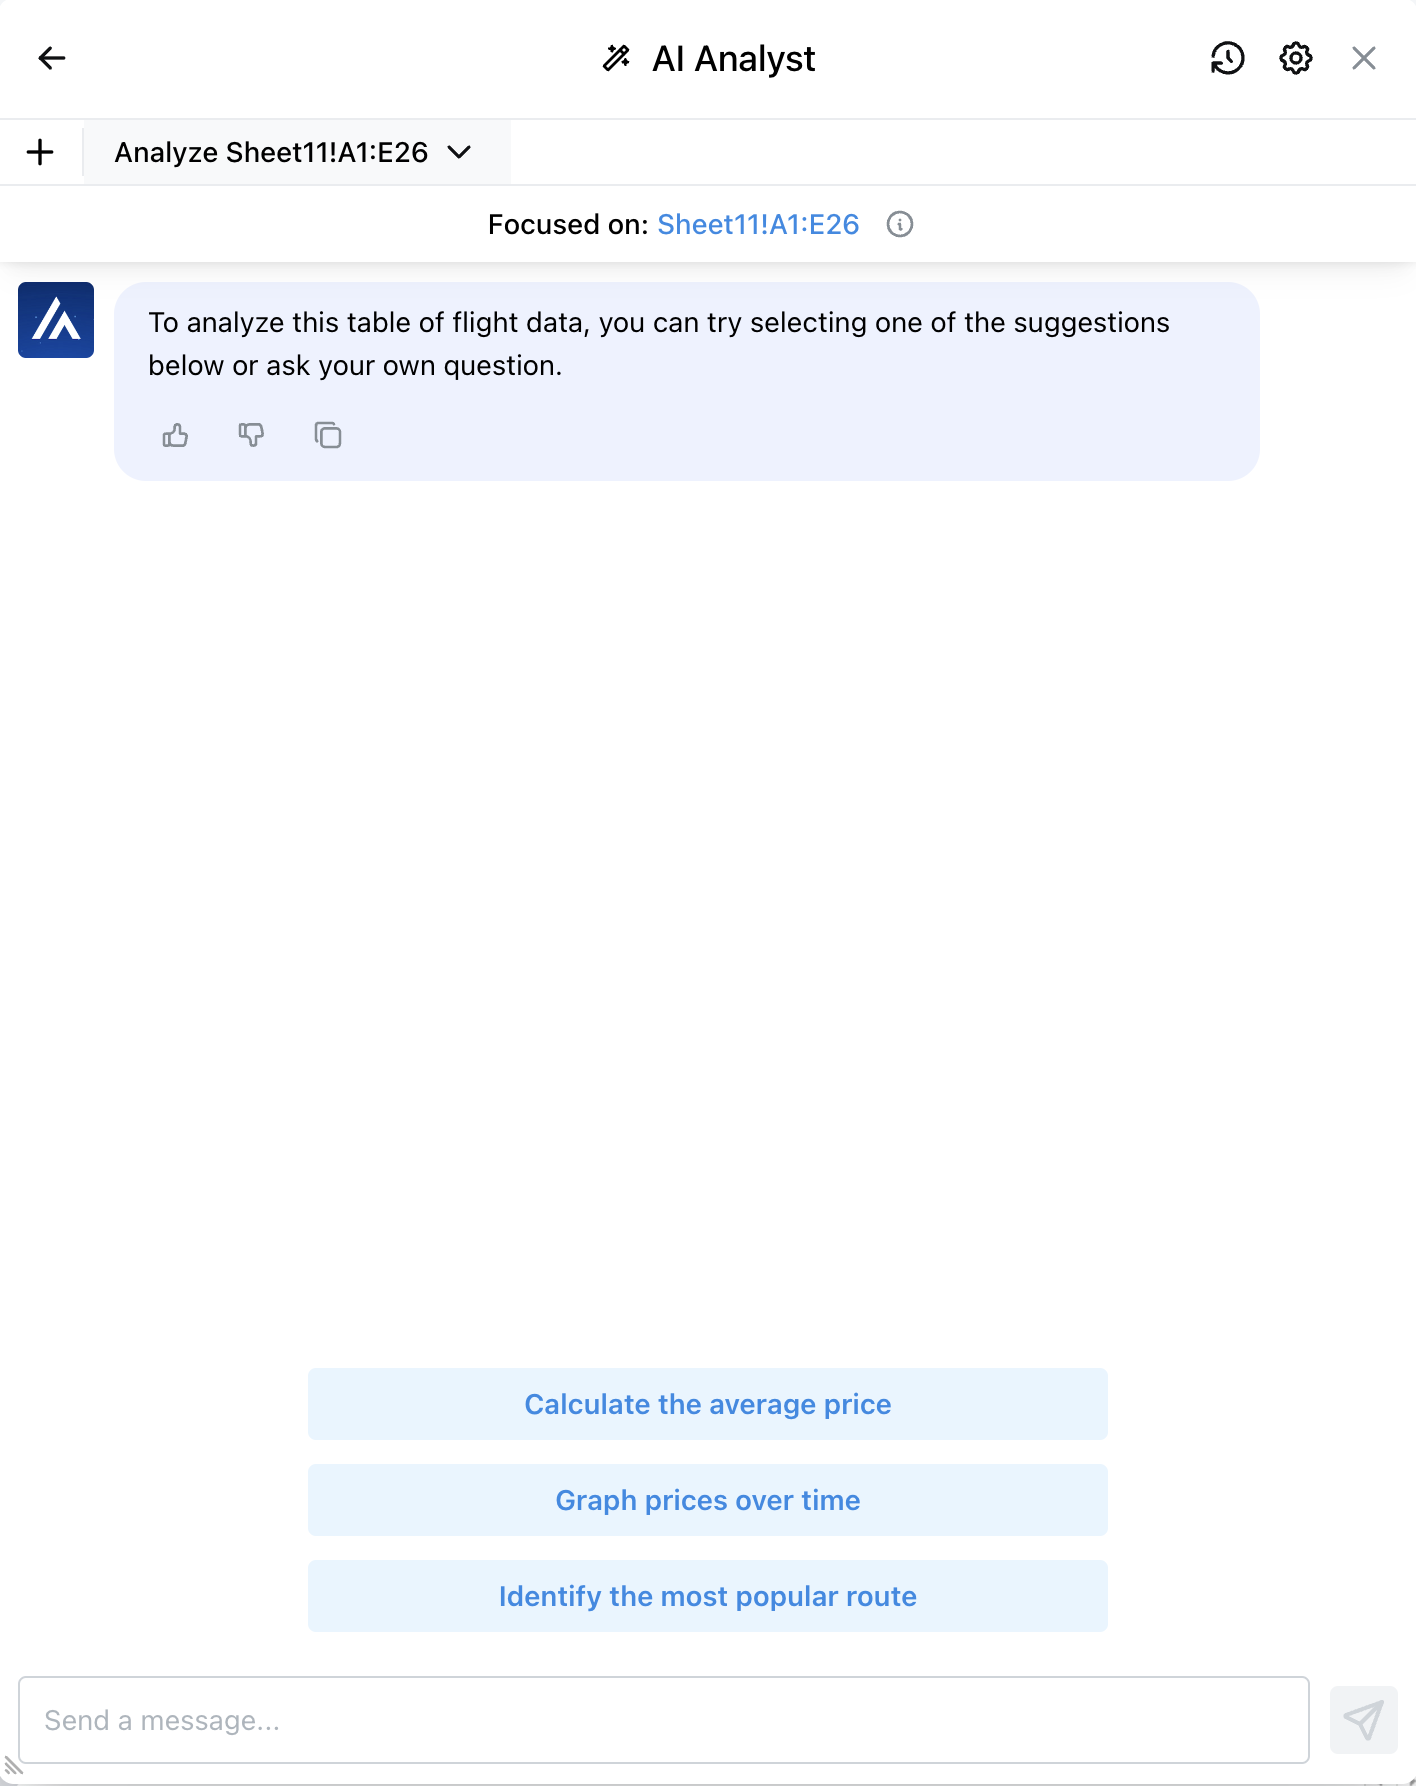
* Use AI to find the right data or assist with your analysis: [Using AI Analyst in Sheets](/using-arcwise-ai-analyst/using-ai-analyst-in-sheets)<br>


# Arcwise setup

Thanks for trying Arcwise! We’re really excited to work with you and empower your Sheets users to access, analyze, and visualize data in your data warehouse.

In this manual, we'll walk you through the steps necessary to get up and running with Arcwise.

{% content-ref url="/pages/LqMWJFWWt4qjrix0UBoc" %}
[User & Role Management](/arcwise-setup/user-and-role-management)
{% endcontent-ref %}

{% content-ref url="/pages/nrcOIiqOY0PhMr0pDXll" %}
[Connect Data Warehouse](/arcwise-setup/connect-data-warehouse)
{% endcontent-ref %}

{% content-ref url="/pages/sYFPl7us0kr7XIx7bQTL" %}
[Add to Google Workspace](/arcwise-setup/add-to-google-workspace)
{% endcontent-ref %}


# 🔐 SAML Single Sign-On (SSO)

Our application supports **SAML-based Single Sign-On (SSO)** to help organizations centrally manage user authentication through their Identity Provider (IdP), such as Okta, Azure AD, or Google Workspace.

### ⚠️ Important Note About Login Options

By default, we use **Google OAuth** to authenticate users. However, **once SAML is enabled**, **Google Sign-In will be disabled**. All users in your organization will be required to log in using your configured **SAML Identity Provider**.

### 1. Enable SAML in Your Admin Console

In your admin settings:

* Navigate to the **Authentication** section.
* Enable the **SAML Enabled** toggle.
* Fill the **SAML Metadata** of your Identity Provider.
* Save the configuration.

> 📌 Your metadata XML typically starts with:
>
> ```xml
> <?xml version="1.0" encoding="UTF-8"?>
> <md:EntityDescriptor entityID="http://www.okta.com/..."
> ```

<figure><img src="/files/w2jDDpGm3kT8SRk1I67w" alt=""><figcaption><p>SAML Metadata is required</p></figcaption></figure>

### 2. Obtain our Service Provider (SP) Metadata

You will need the service metadata to configure our service within your Identity Provider. To obtain it, on the same page, click on the **Service Provider Metadata** button. You should see a modal with the following information

* **Entity ID**
* **ACS (Assertion Consumer Service) URL**
* **NameID Format**

<figure><img src="/files/P5bNSN6CJNhLLf5x06Og" alt=""><figcaption><p>The values here are an example from our sandbox environment</p></figcaption></figure>

Use this information to configure a new SAML application in your IdP.

### ✅ Finalize and Test

Once configured:

* Test logging in via your Identity Provider. To do so, click on **Sign in with SSO** button.
  * Sign in with Google will not work anymore, unless you disable SAML.
  * SSO must be used on the Web version and on the Admin too.
* Ensure user accounts match by email address (as per NameID format).

If you encounter any issues, feel free to reach out to our support team for assistance.

<figure><img src="/files/e1b6DBdFwDPC4nEON3e1" alt=""><figcaption><p>Buttons for login</p></figcaption></figure>

### 👥 Optional: SCIM for User Provisioning

We also support **SCIM (System for Cross-domain Identity Management)** to allow automated provisioning and deprovisioning of users from your Identity Provider.

With SCIM, you can:

* Automatically **create users** in our platform when they're assigned access in your IdP.
* Automatically **deactivate users** when they're unassigned or removed in your IdP.
* Sync user attributes like name, email, and groups.

To enable SCIM:

1. For now we only support **Bearer Token** authentication that must be configured on the Admin.
2. The base be obtained by cliking on the SCIM Endpoint button.
3. Configure your Identity Provider (Okta, Azure AD, etc.) with the provided SCIM endpoint and token.
4. Set up attribute mappings as needed.

> 📌 SCIM is optional but highly recommended for teams managing users at scale.

<figure><img src="/files/OcnAiIYxRphmAKigX7z6" alt=""><figcaption></figcaption></figure>


# User & Role Management

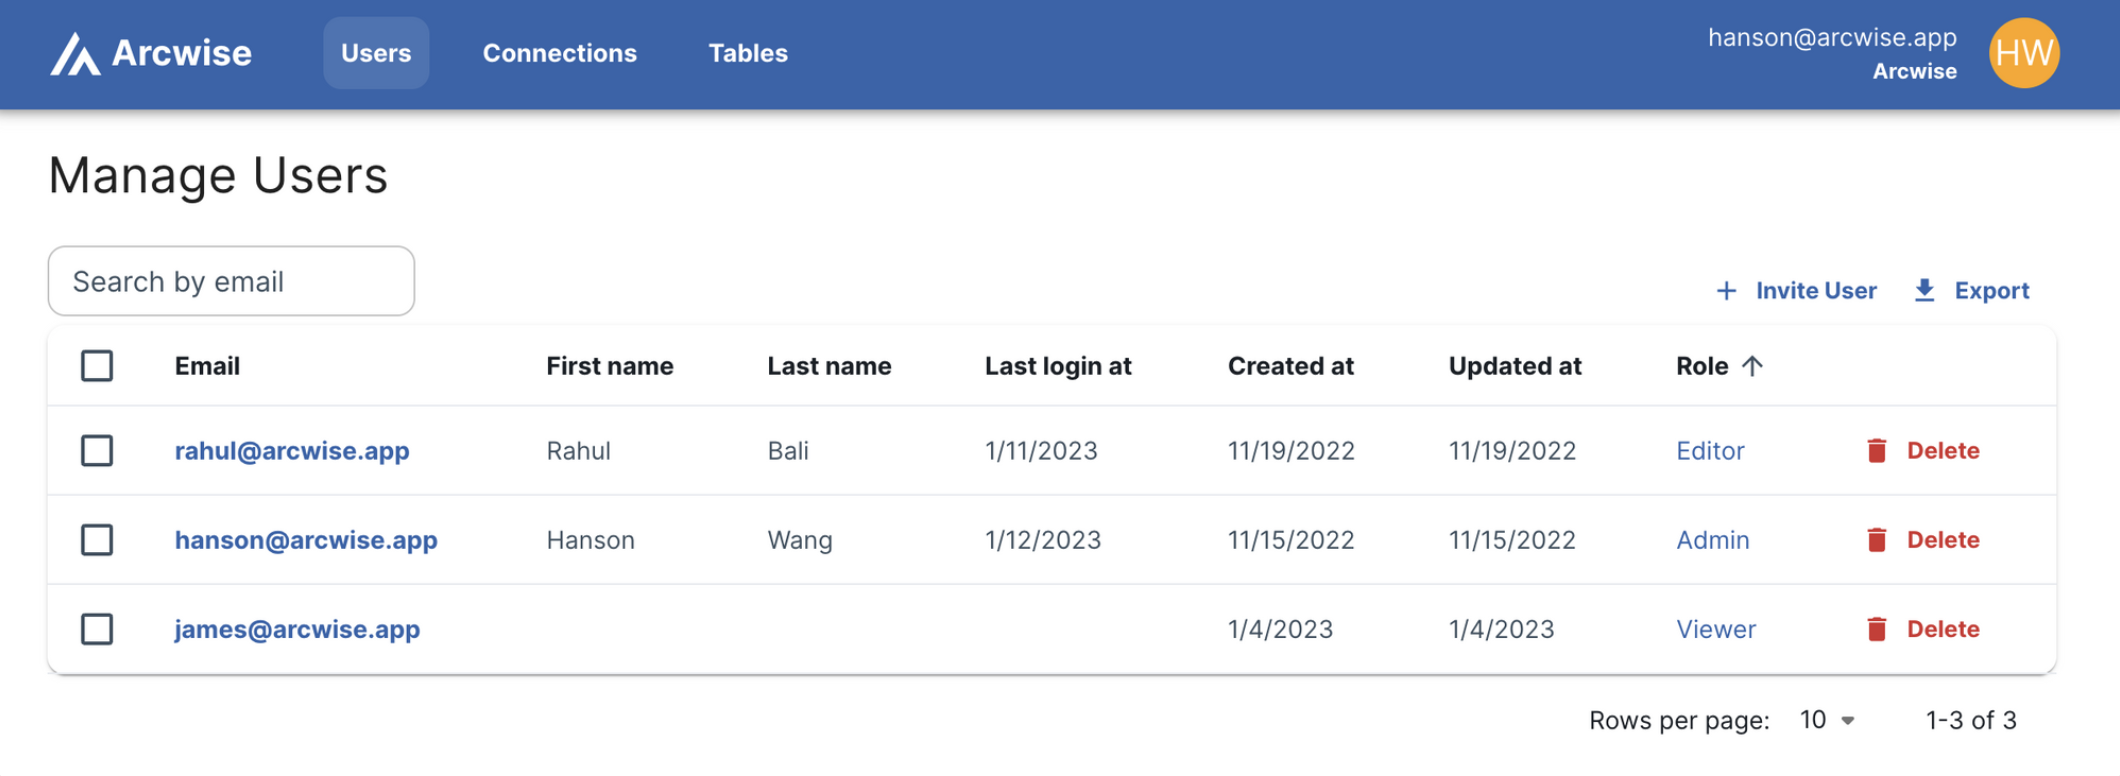
The Arcwise administrative portal at [https://admin.arcwise.app](https://admin.arcwise.app/) is the central way to manage (1) user access to Arcwise and (2) connections to Snowflake & dbt instances.

### Logging into the admin portal

1. Navigate to <https://admin.arcwise.app>
2. Click “Login with Google” and choose your **corporate Google Workspace account** (i.e. <name@company.com>, not your Gmail account.)
3. If successful, you should be taken to a “Manage Users” page where you can manage users in your organization.

<figure><img src="/files/vkQ9kBduZ5i5G7mncz5a" alt=""><figcaption></figcaption></figure>

### Inviting Users

1. Click the “Invite User” button on the right side of the page. This should bring up a “Invite User” form with email and role fields.
2. Enter the company email address for the user you would like to add.
3. Select a **role** for this user:
   1. **Admin:** Has full management permissions in the Arcwise admin portal (can add/remove/re-assign user roles and edit all data connections).
   2. **Editor:** Can edit data connections in the admin portal but **not** user roles.
   3. **User:** End-user of the Arcwise application. Will be able to log in and access connected data through the Google Sheets add-on but not in the admin portal.
4. Once you press save, access will be granted. (NOTE: At the moment we won’t send any email notifications).
5. Access can be removed through the “Delete” buttons. You can also click on entries in the “Role” column to change a user’s role.


# Add to Google Workspace

Arcwise requires a Chrome extension to beinstalled. This can be done at the individual level or at the admin level (if you are a Google Workspace administrator).

## Chrome extension

* Arcwise Chrome extension: <https://chrome.google.com/webstore/detail/arcwise/gcambpmifmpmaenjfjlelhpmelbinnil>
  * Click "Add to Chrome" to add it to your browser (for individual install).
* Assuming Chrome is managed on company devices, [follow the Google instructions](https://support.google.com/chrome/a/answer/6306504) to install the Arcwise extension for user devices automatically.
  * Otherwise, users will have to install the Chrome extension themselves.
* The Chrome extension is used to display a persistent Arcwise icon in the top-right corner of Google Sheets. Click the Arcwise icon and log in to access Arcwise more easily.
  * Use Cmd+Shift+1 (Ctrl+Shift+1 on Windows) to open the Arcwise popover.

<figure><img src="/files/rMDBNIZF9wqWuA1ZEs0y" alt=""><figcaption></figcaption></figure>


# Connect Data Warehouse

{% hint style="warning" %}

### Before you Begin

If you haven’t already, add users that will require access while setting up your data warehouse connection: [User & Role Management](/arcwise-setup/user-and-role-management)
{% endhint %}

{% hint style="info" %}
If you need to add a fixed IP address to your data warehouse allowlist or network policy, please refer to our  [Arcwise Fixed IP Address](/arcwise-setup/connect-data-warehouse/arcwise-fixed-ip-address) page.
{% endhint %}

### Select your warehouse:

{% content-ref url="/pages/QlNP8cYEbo828lQDPL6g" %}
[Snowflake](/arcwise-setup/connect-data-warehouse/snowflake)
{% endcontent-ref %}

{% content-ref url="/pages/37EBgFUCX1oxycFmz8ye" %}
[BigQuery](/arcwise-setup/connect-data-warehouse/bigquery)
{% endcontent-ref %}

{% content-ref url="/pages/tzHZxCFC94B0XHtIpjwX" %}
[Postgres](/arcwise-setup/connect-data-warehouse/postgres)
{% endcontent-ref %}

{% content-ref url="/pages/2WZAiPW8nTCcmClnFNSH" %}
[Databricks](/arcwise-setup/connect-data-warehouse/databricks)
{% endcontent-ref %}

{% content-ref url="/pages/oWhD8coy7mmbJPU08FDa" %}
[Athena](/arcwise-setup/connect-data-warehouse/athena)
{% endcontent-ref %}


# Arcwise Fixed IP Address

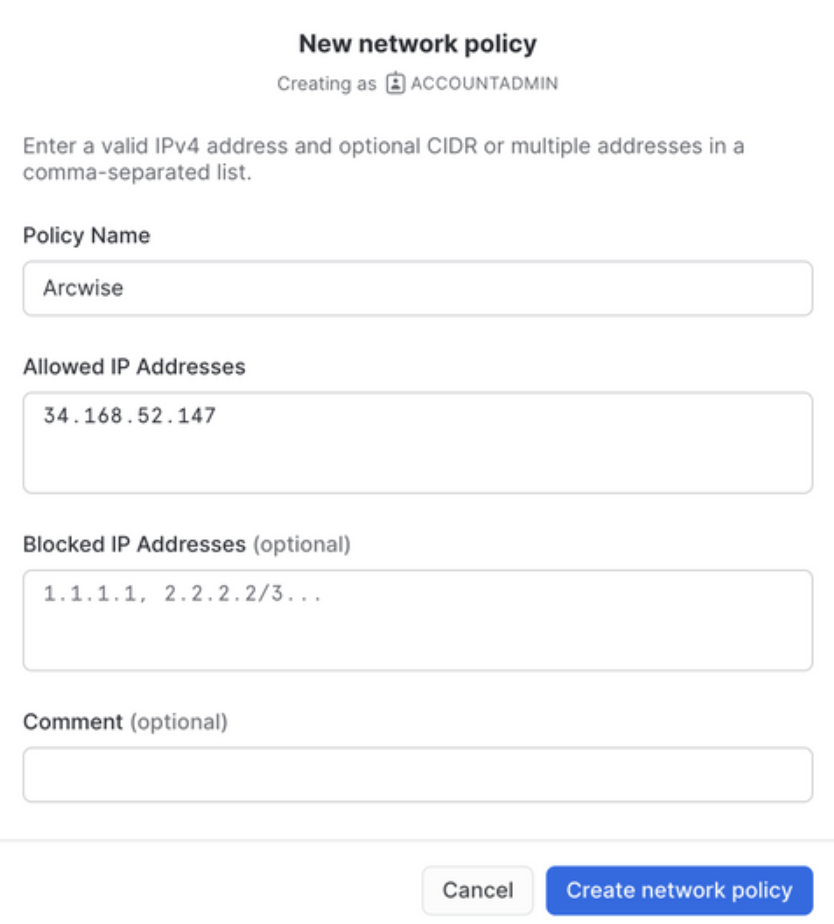
If your data warehouse has an IP allowlist or a network policy defined, you’ll need to allow our IP address through:

### `34.168.52.147`

See the screenshot below for an example of applying a [network policy on Snowflake](https://docs.snowflake.com/en/user-guide/network-policies.html).

{% hint style="warning" %}
**Note:** For Snowflake, if this is the first network policy you are creating this will also **turn on your network policies** for the first time. Be sure to verify other applications retain access to your warehouse in this case.
{% endhint %}

<figure><img src="/files/qnl9x6ipiHBQgC70Futh" alt="" width="375"><figcaption></figcaption></figure>


# Snowflake

## Step 1: Create a New User/Role for Arcwise

We recommend creating a separate Snowflake user & role for Arcwise access to have better visibility and granular access management. (It’s possible to skip to step 2 and provide an existing set of credentials instead).

## (Optional) Allow connection from Arcwise IP address

If you need to add a fixed IP address to your allowlist or network policy, please refer to our  [Arcwise Fixed IP Address](/arcwise-setup/connect-data-warehouse/arcwise-fixed-ip-address) page.

#### Creating a new user/role

We’ve provided a script here to help with role and user creation. You can paste this directly into Snowsight **if you have SYSADMIN or ACCOUNTADMIN privileges.**

{% hint style="danger" %}
**IMPORTANT**

* Take care to replace the **highlighted values** in the query below!
* Make sure to **execute all of the queries! S**elect the entire query text before running if using Snowsight, or check the “All Queries” checkbox if using the legacy console.
  {% endhint %}

By default, this will allow the Arcwise role to access all schemas in `$database_name`, but this can be restricted if preferred (see highlighted `GRANT USAGE ON SCHEMA` below). Be sure that each query runs successfully!

```sql
-- (Optional) Edit these if you prefer something else.
SET role_name = 'ARCWISE_ROLE';
SET user_name = 'ARCWISE_USER';
-- (Optional) You can also use an existing warehouse if desired.
SET warehouse_name = 'ARCWISE_WAREHOUSE';

-- Define a password for the Arcwise user (ideally randomly generated). Remember it for later
SET user_password = '<your-password-here>';

-- Database you want to allow Arcwise to access and snapshot schema that
-- will be created in that database for data snapshot management
SET database_name = '<your-database-here>';
SET snapshot_schema_name = '_ARCWISE_SNAPSHOTS';

-- Database setup
CREATE DATABASE IF NOT EXISTS IDENTIFIER($database_name) COMMENT = 'Arcwise database';

-- Warehouse setup
CREATE WAREHOUSE IF NOT EXISTS IDENTIFIER($warehouse_name)
	warehouse_size = small
	warehouse_type = standard
	auto_suspend = 15
	auto_resume = true
	initially_suspended = true;

-- Role setup
CREATE ROLE IF NOT EXISTS IDENTIFIER($role_name) COMMENT = 'Arcwise default role';

-- User setup
CREATE USER IF NOT EXISTS IDENTIFIER($user_name)
	password = $user_password
	first_name = 'Arcwise'
	last_name = 'User'
	default_warehouse = $warehouse_name
	default_role = $role_name;

-- Assign user -> role
GRANT ROLE IDENTIFIER($role_name) TO USER IDENTIFIER($user_name);

-- Allow role -> warehouse & database
GRANT USAGE ON WAREHOUSE IDENTIFIER($warehouse_name) TO ROLE IDENTIFIER($role_name);
GRANT USAGE ON DATABASE IDENTIFIER($database_name) TO ROLE IDENTIFIER($role_name);

-- Allow role to access all schemas (and tables/views within the schema)
GRANT USAGE ON ALL SCHEMAS IN DATABASE IDENTIFIER($database_name) TO ROLE IDENTIFIER($role_name);
GRANT USAGE ON FUTURE SCHEMAS IN DATABASE IDENTIFIER($database_name) TO ROLE IDENTIFIER($role_name);
-- (Optional) To restrict access to certain schemas: comment out the two lines above and edit below
-- GRANT USAGE ON SCHEMA <your-database>.<your-schema> TO ROLE IDENTIFIER($role_name);

GRANT SELECT ON ALL TABLES IN DATABASE IDENTIFIER($database_name) TO ROLE IDENTIFIER($role_name);
GRANT SELECT ON FUTURE TABLES IN DATABASE IDENTIFIER($database_name) TO ROLE IDENTIFIER($role_name);

GRANT SELECT ON ALL VIEWS IN DATABASE IDENTIFIER($database_name) TO ROLE IDENTIFIER($role_name);
GRANT SELECT ON FUTURE VIEWS IN DATABASE IDENTIFIER($database_name) TO ROLE IDENTIFIER($role_name);

-- Create snapshot schema and grant role ownership over that schema
SET arcwise_snapshots_schema = $database_name || '.' || $snapshot_schema_name;
CREATE SCHEMA IF NOT EXISTS IDENTIFIER($arcwise_snapshots_schema) COMMENT = 'Arcwise-operated schema for managing data snapshots';
GRANT OWNERSHIP ON SCHEMA IDENTIFIER($arcwise_snapshots_schema) TO ROLE IDENTIFIER($role_name) REVOKE CURRENT GRANTS;

-- Allow Arcwise role to analyze query history & table usage activity
GRANT IMPORTED PRIVILEGES ON DATABASE SNOWFLAKE TO ROLE IDENTIFIER($role_name);
```

By default the above commands will *not* give the `SYSADMIN` role access to data managed by Arcwise. To have the Arcwise role inherit from `SYSADMIN` and therefore grant that role full access run the following command:

```sql
GRANT ROLE IDENTIFIER($role_name) TO ROLE SYSADMIN;
```

## Step 2: Add Snowflake credentials in Arcwise

1. Go to the “Connections” tab in the Arcwise admin panel (<https://admin.arcwise.app/#/warehouse_connections>)
2. Click on the “Create” button to add the first connection.
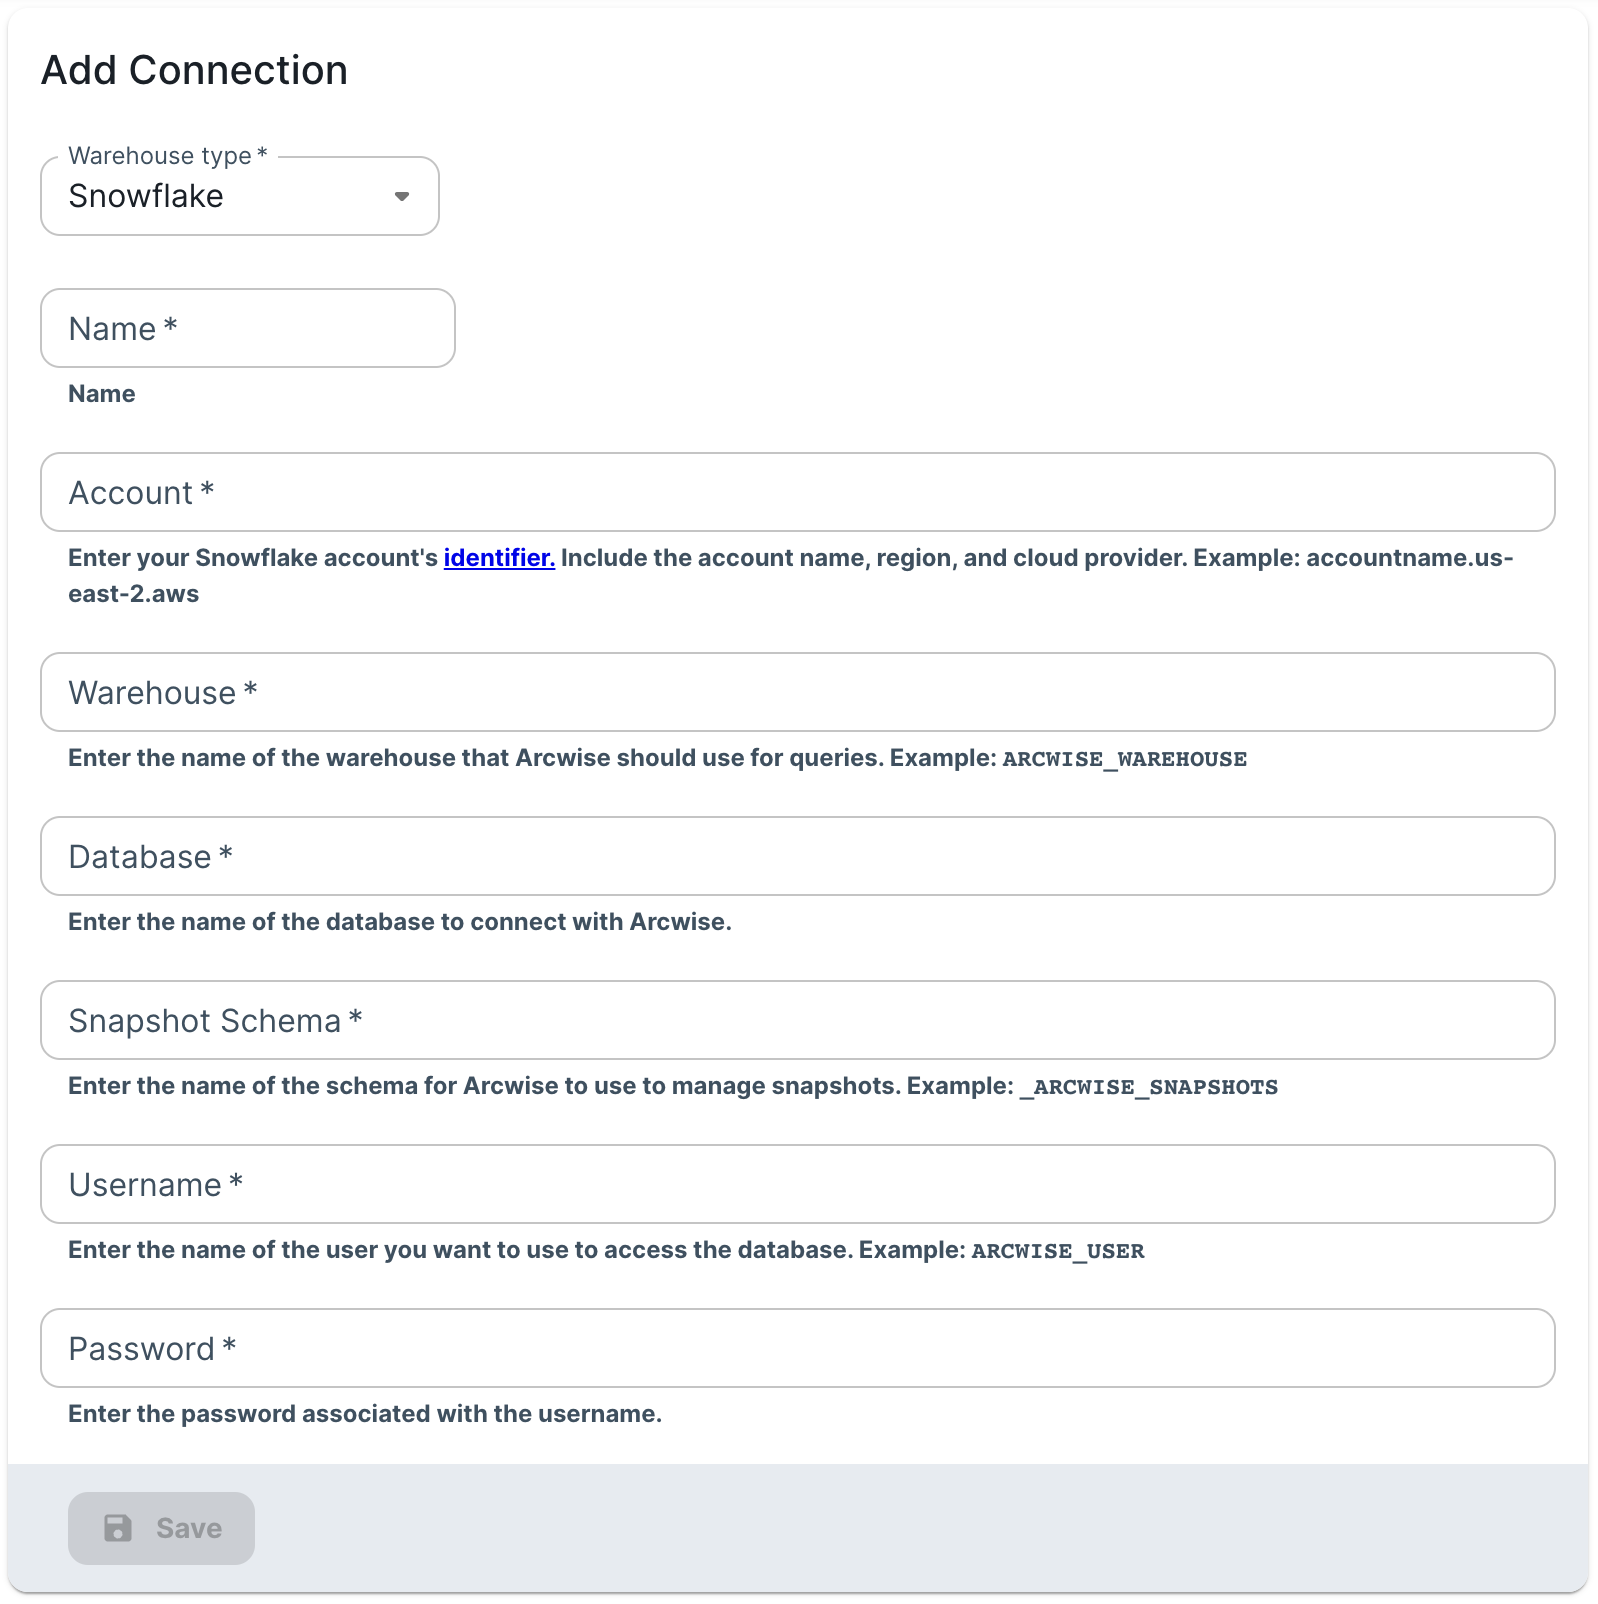
3. Fill out the credentials based on the variables you filled in above. Additional instructions can be found for each section below.

<figure><img src="/files/GVNvVbjmJUans0flpbAq" alt="" width="563"><figcaption></figcaption></figure>

<details>

<summary>Name</summary>

A user-friendly name that describes the purpose of the connection. Will be shown to end-users in Arcwise.

</details>

<details>

<summary>Account</summary>

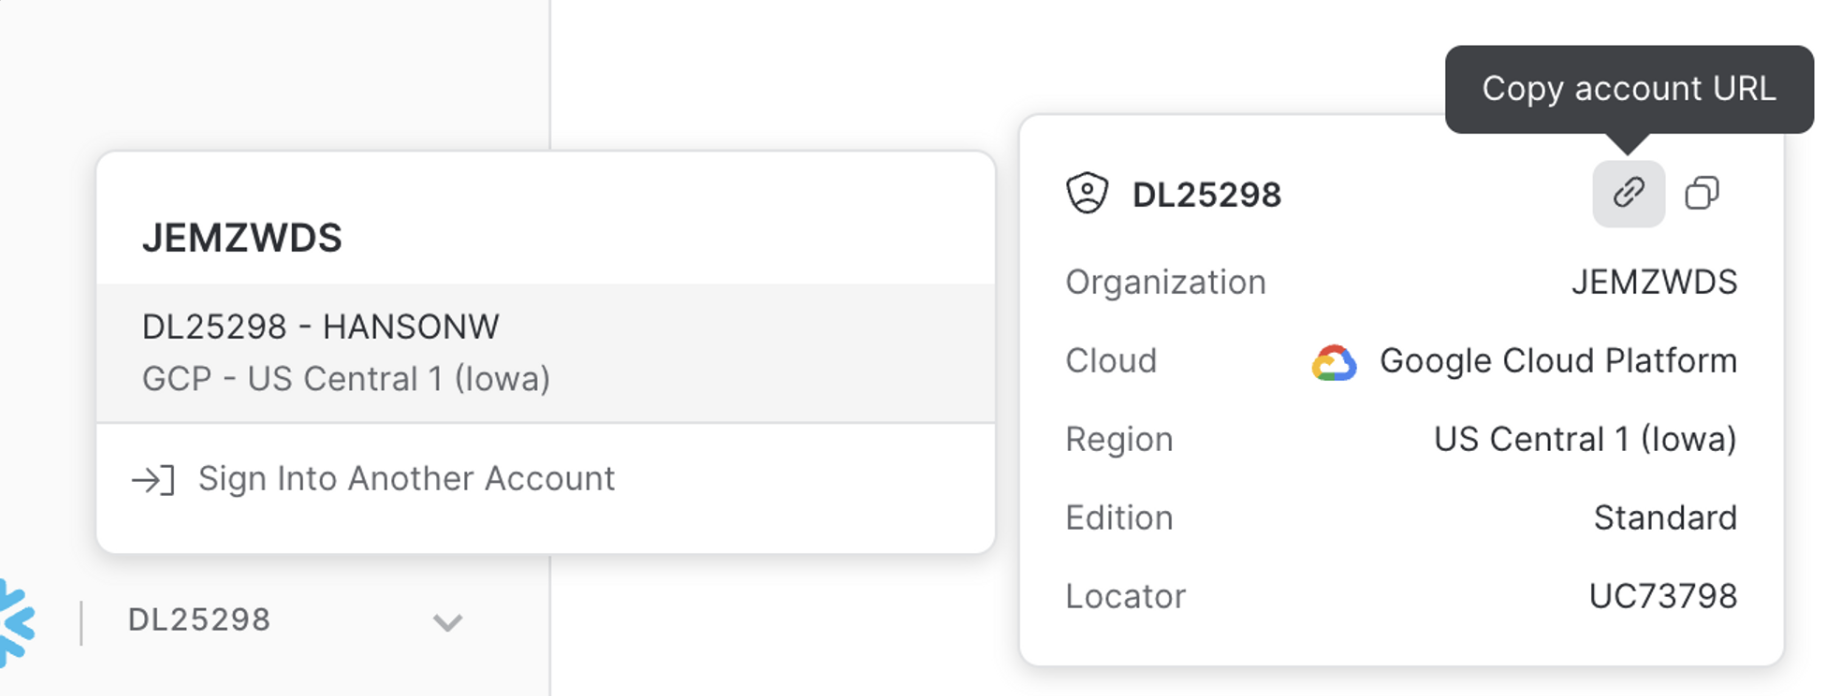
This is your [Snowflake account identifier](https://docs.snowflake.com/en/user-guide/admin-account-identifier.html#using-an-account-locator-as-an-identifier). It should be in the format:

`account_locator.cloud_region_id.cloud`

EG: `uc1234.us-west-1.aws`&#x20;

In Snowsight, you can hover over account menu in the bottom left and click **Copy account URL**; then remove the leading `https://` and trailing `.snowflakecomputing.com`

<img src="/files/6Ky0jt67Qj9jOMiaIP7O" alt="" data-size="original">

</details>

<details>

<summary>Warehouse</summary>

Use the `$warehouse_name` value from the SQL query (e.g. `ARCWISE_WAREHOUSE`)

</details>

<details>

<summary>Database</summary>

Use the `$database_name` value from the SQL query.

</details>

<details>

<summary>Snapshot Schema</summary>

Use the `$snapshot_schema_name` value from the SQL query.

</details>

<details>

<summary>Username/Password</summary>

`$user_name` and `$user_password` from the SQL query.

</details>

All credentials are stored securely using bank-level (256-bit) encryption. Once you hit Save and the connection has been added, you can switch over to the “Tables” tab to see all the tables that will be exposed in Arcwise.

{% hint style="warning" %}
If you get an error that the username/password didn’t work, please double check that the all queries in the “Create a new user/role” script ran successfully.
{% endhint %}


# BigQuery

{% hint style="info" %}
If your organization uses Google Cloud [Private Service Connect](https://cloud.google.com/vpc/docs/private-service-connect), Arcwise can’t support it yet. Please let us know if this is something you need!
{% endhint %}

## Step 1: Create a Service Account in GCP

1. Choose an existing service account or create a new one. Instructions on setting up a GCP service account can be found [here](https://cloud.google.com/iam/docs/creating-managing-service-accounts). We recommend a new service account: `Arcwise`
2. Grant the service account the proper level of access to BigQuery. More information on permissions [here](https://cloud.google.com/bigquery/docs/access-control-basic-roles). Access should be granted from IAM management. Minimally, Arcwise requires:
   1. BigQuery Job User
   2. BigQuery Read Session User
   3. BigQuery Data Viewer (\* This can be granted on a [per-dataset level](https://cloud.google.com/bigquery/docs/control-access-to-resources-iam#grant_access_to_a_dataset) to only the datasets you would like Arcwise to access)
3. Create a dataset in BigQuery called `arcwise_snapshots`. For more information on creating datasets see [here](https://cloud.google.com/bigquery/docs/datasets).
   * Arcwise will use this dataset to create zero-cost [table snapshots](https://cloud.google.com/bigquery/docs/table-snapshots-intro) of tables that have been connected to Google Sheets.
4. Grant the service account the proper level of access to the `arcwise_snapshots` dataset. For information on how to grant access to an individual dataset see [here](https://cloud.google.com/bigquery/docs/control-access-to-resources-iam#console). Grant the following access:
   1. BigQuery Data Owner
5. Generate a JSON Key file for the service account. This will be used later.

### Step 2: Link Account to Arcwise

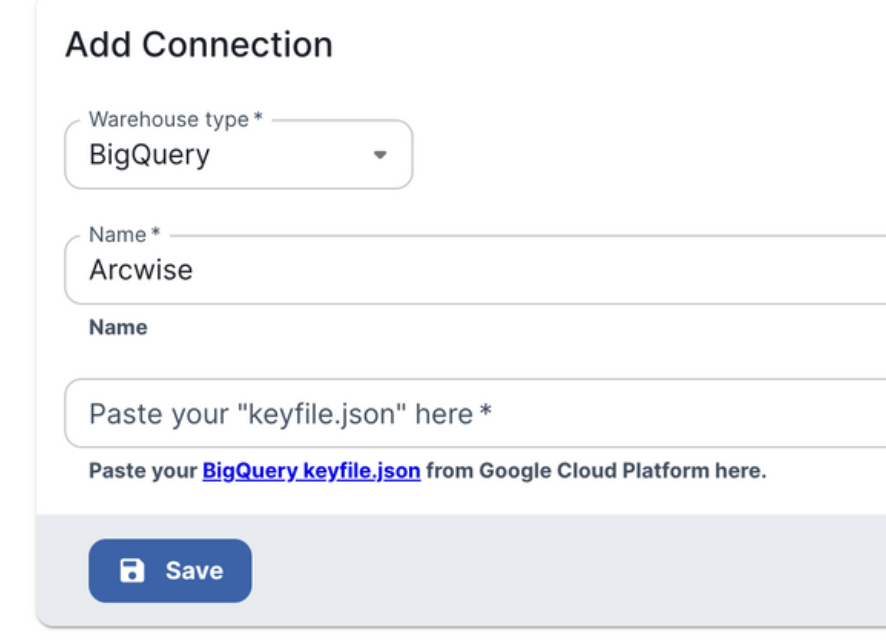
Navigate to <https://admin.arcwise.app/> and go to the connections tab.

Open your JSON key file and copy+paste the contents into the textbox, then press Save.

<figure><img src="/files/t3dcNQpQvbfcXCCRGfG9" alt="" width="375"><figcaption></figcaption></figure>


# Postgres

## (Optional) Create `arcwise USER` in your database

If you plan to use an existing user ignore this step. The existing user must be granted `USAGE` and `SELECT` privileges on the schema(s) you plan to use with Arcwise.

To create a new user follow these steps in `psql`.

```sql
CREATE USER arcwise WITH PASSWORD '{ENTER_PASSWORD_HERE}';

-- Grant usage on the schema and select privileges on the tables
GRANT USAGE ON SCHEMA public TO arcwise;
GRANT SELECT ON ALL TABLES IN SCHEMA public TO arcwise;

-- OPTIONAL - Revoke select for table(s) that you would prefer to hide 
REVOKE SELECT ON TABLE {your_hidden_table} from arcwise;
```

## (Optional) Allow connection from Arcwise IP address

If you need to add a fixed IP address to your allowlist or network policy, please refer to our  [Arcwise Fixed IP Address](/arcwise-setup/connect-data-warehouse/arcwise-fixed-ip-address) page.

### Link Account to Arcwise

Navigate to <https://admin.arcwise.app/> and go to the connections tab.

Input the required fields to link with the user created in Step 1


# Databricks

## (Optional) Allow connection from Arcwise IP address

If you need to add a fixed IP address to your allowlist or network policy, please refer to our  [Arcwise Fixed IP Address](/arcwise-setup/connect-data-warehouse/arcwise-fixed-ip-address) page.

## Add Databricks credentials in Arcwise

1. Log into the Arcwise Admin portal and [set up users/roles for your team first](/arcwise-setup/user-and-role-management).
2. Go to the “Connections” tab in the Arcwise admin panel (<https://admin.arcwise.app/#/warehouse_connections>)
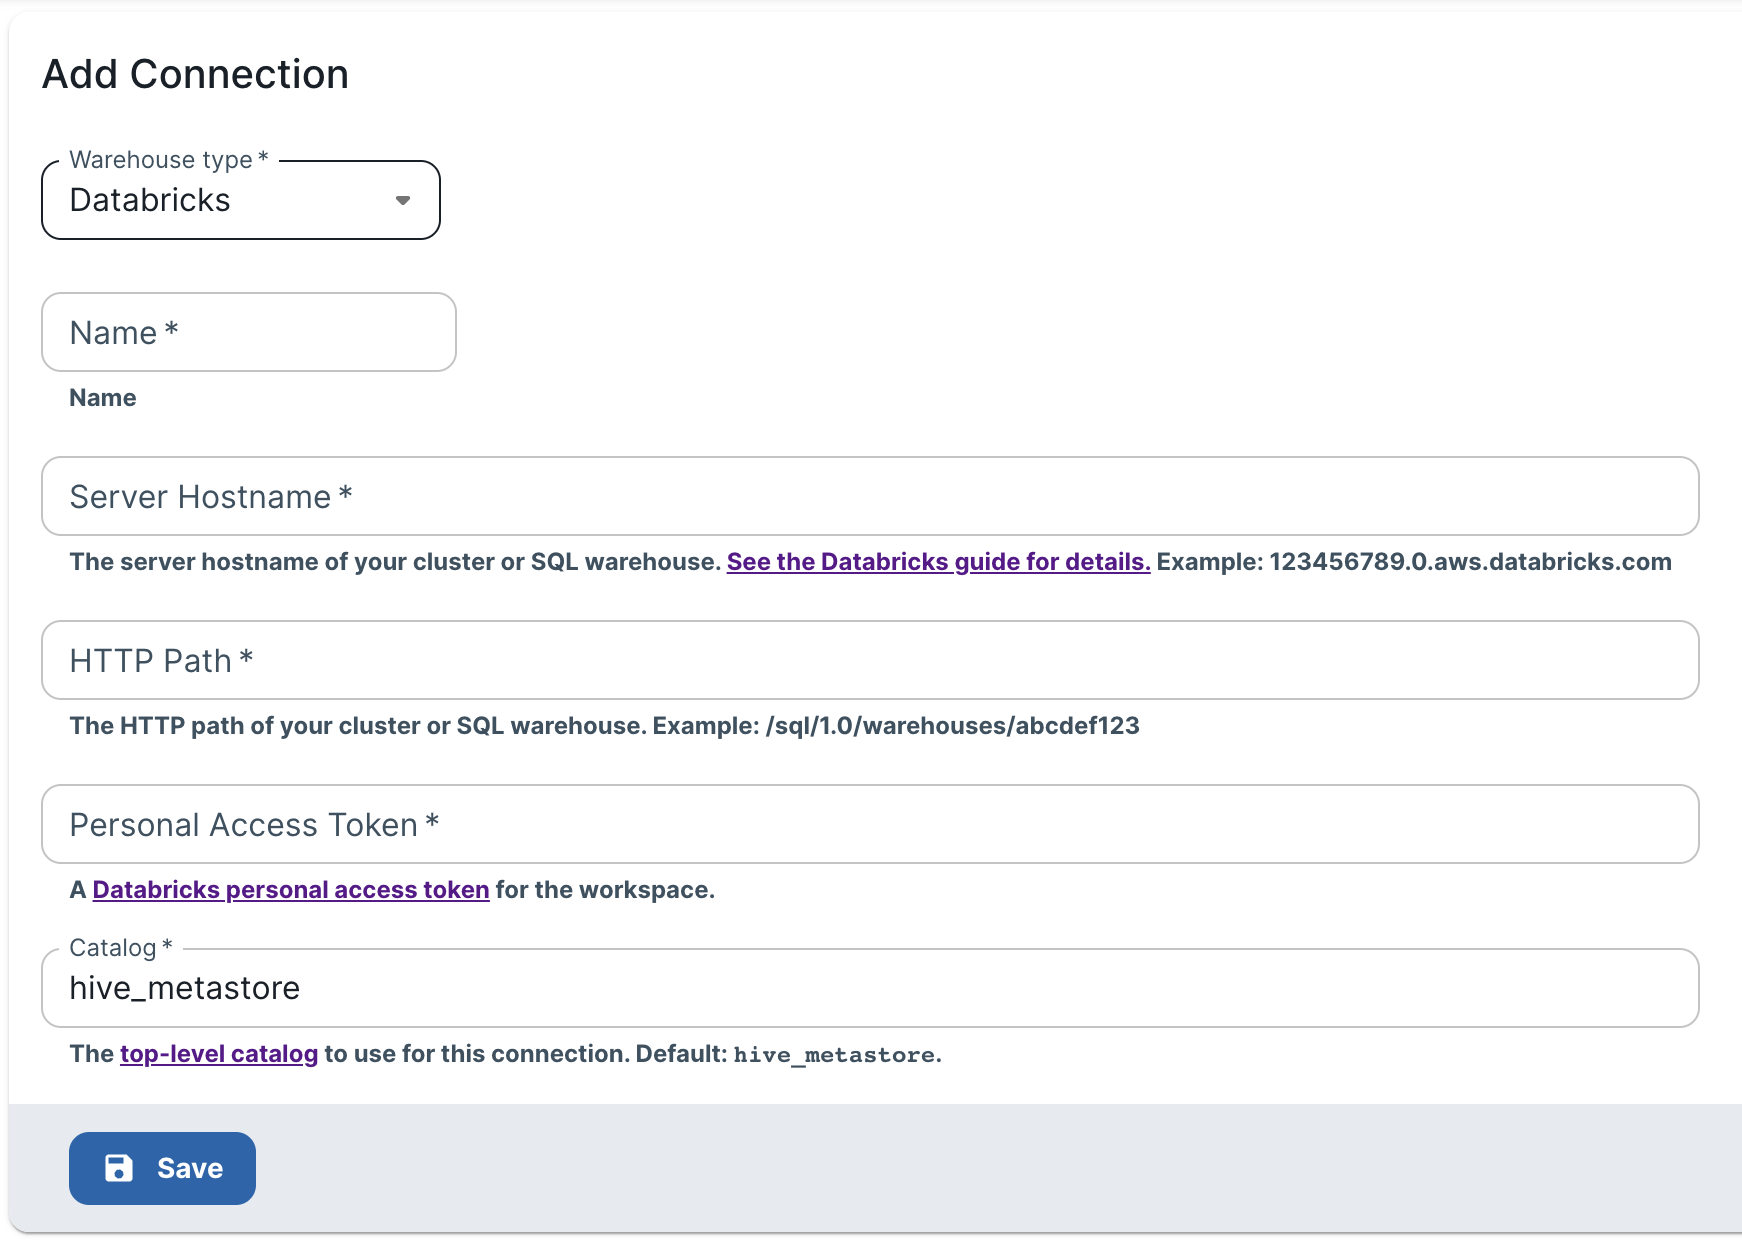
3. Click on the “+ Create” button (top-right) and select "Databricks" from the Warehouse Type dropdown.

<figure><img src="/files/HeXq151mWsQDRAY0v5D0" alt="" width="563"><figcaption><p>(You should see these fields for Databricks connections).</p></figcaption></figure>

### Information about required fields

1. **Name** - A user-friendly name used for display purposes in the Arcwise interface. Can be anything you want.
2. **Server Hostname / HTTP Path**
   1. Follow the Databricks documentation on finding these fields - for compute clusters, this will be on the **Advanced Options > JDBC/ODBC** settings page, and for SQL warehouses this will be under **Connection Details**. <https://docs.databricks.com/integrations/jdbc-odbc-bi.html#retrieve-the-connection-details>&#x20;
3. **Personal Access Token** - must be an access token with permissions to use the warehouse/cluster provided above. See the docs for the required permissions: <https://docs.databricks.com/integrations/jdbc-odbc-bi.html#permission-requirements>
   1. *Arcwise only requires read permissions. We recommend that you ensure the PAT has finer-grained permissions for safety purposes; Arcwise users can execute SELECT SQL queries to access any schemas and tables that the PAT has (read) access to.*
4. **Catalog** - The top-level catalog (as shown in Databricks' Data Explorer) that you would like Arcwise to access. **If you're not using Unity Catalog, this must be `hive_metastore`.**

### **Checking indexed tables/views**

Arcwise will automatically index your data catalog upon the initial connection; our index will also automatically refresh every day at midnight PST.

Go to the [Tables page](https://admin.arcwise.app/#/warehouse_entities) in the Arcwise panel to see the list of indexed tables / views.

To manually re-index tables, you can press the "Sync" button back on the [Connections page](https://admin.arcwise.app/#/warehouse_connections).

### (Optional) Connecting to dbt

Arcwise supports indexing your dbt catalog to surface metrics and models in the UI. If you'd like us to do this, proceed to the next step to connect your dbt credentials.


# Athena

## (Optional) Allow connection from Arcwise IP address

If you need to add a fixed IP address to your allowlist or network policy, please refer to our  [Arcwise Fixed IP Address](/arcwise-setup/connect-data-warehouse/arcwise-fixed-ip-address) page.

## Add Athena credentials in Arcwise

1. Log into the Arcwise Admin portal and [set up users/roles for your team first](/arcwise-setup/user-and-role-management).
2. Go to the “Connections” tab in the Arcwise admin panel (<https://admin.arcwise.app/#/warehouse_connections>)
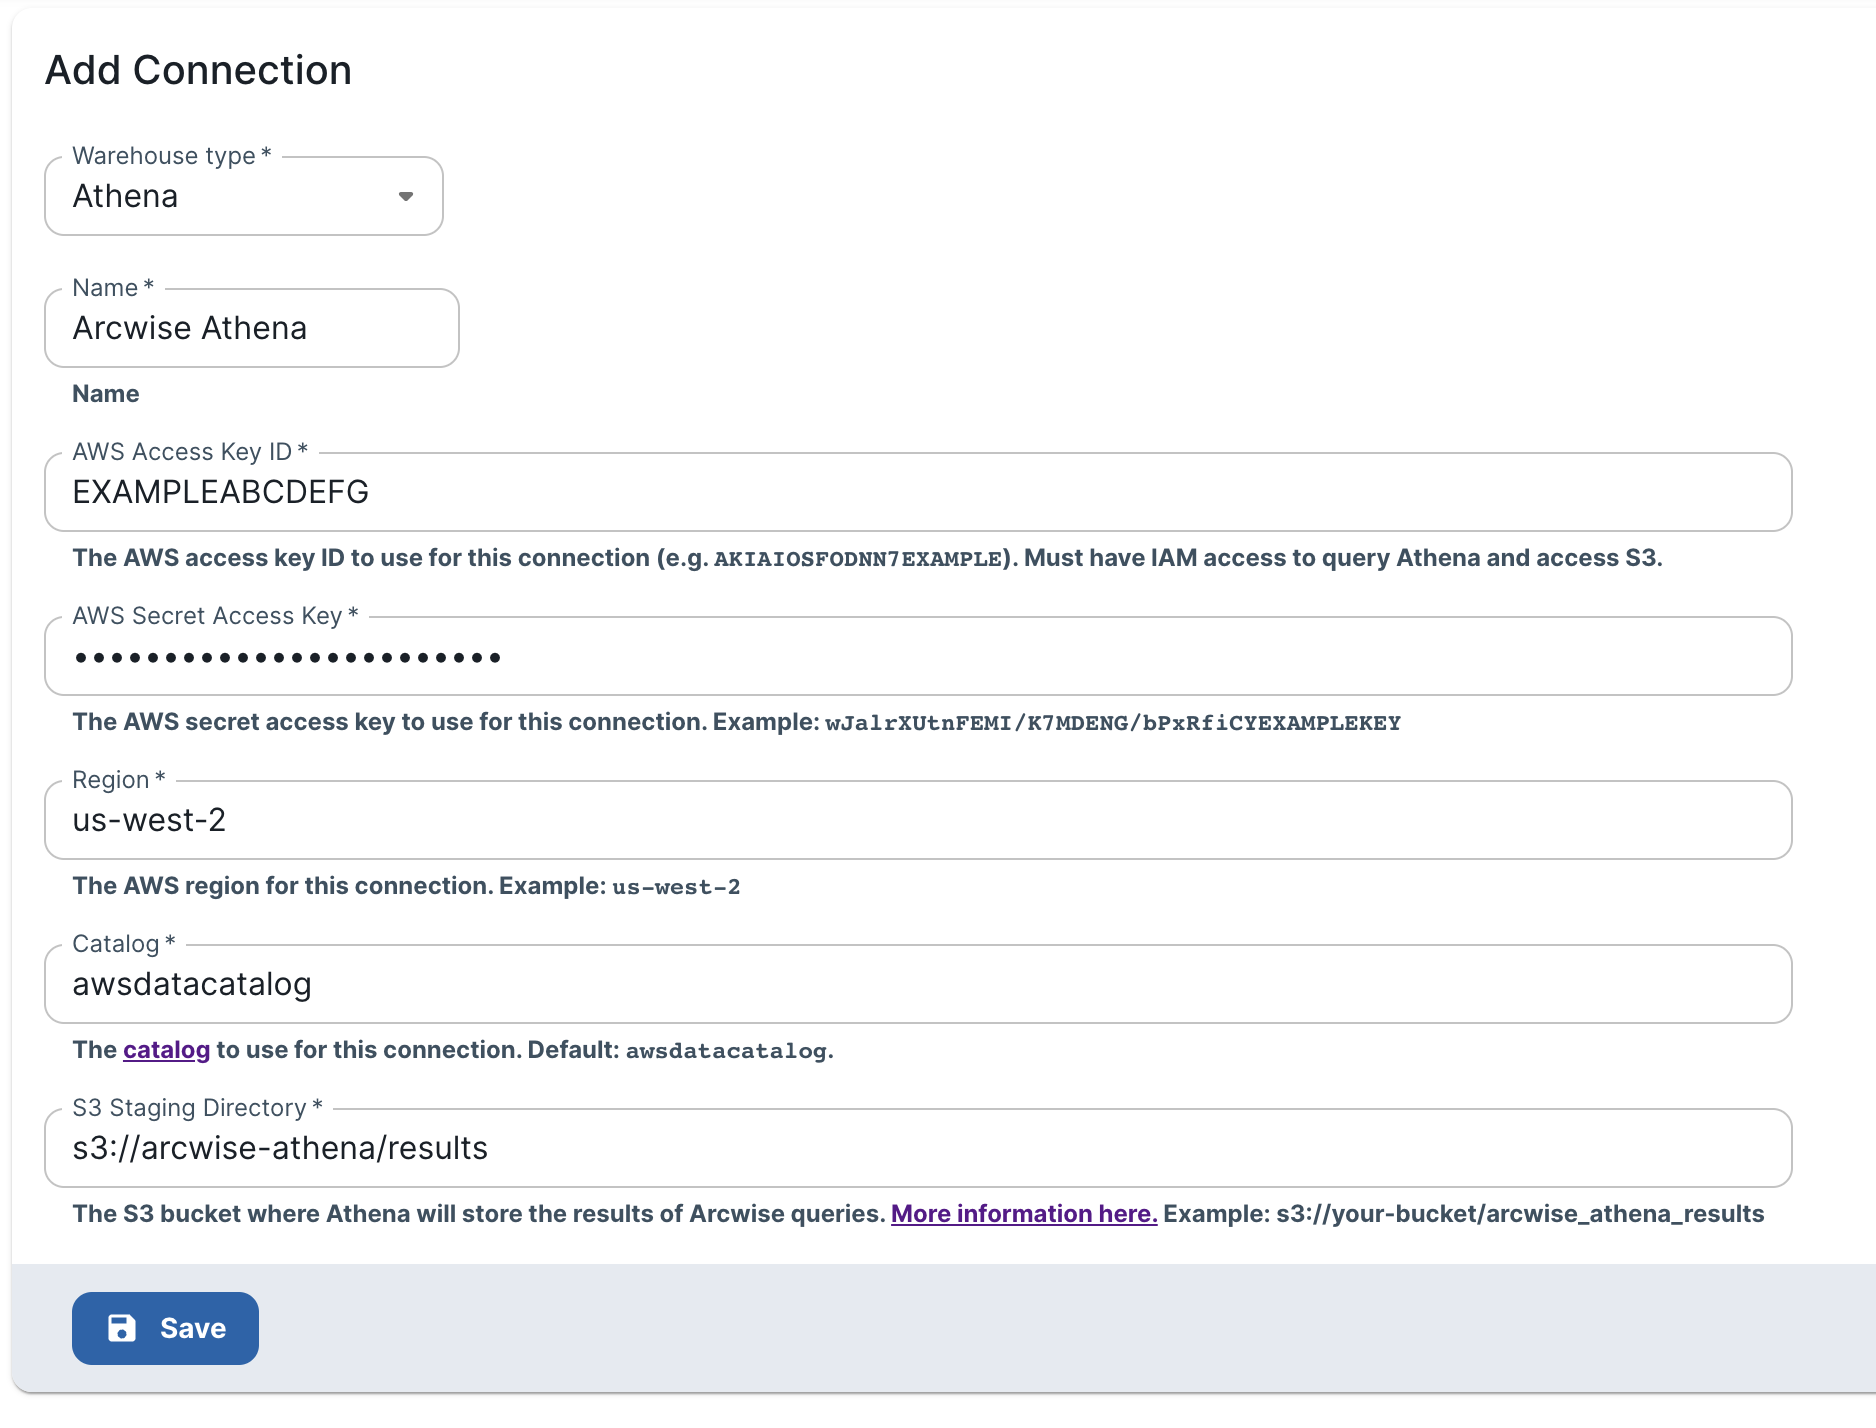
3. Click on the “+ Create” button (top-right) and select "Athena" from the Warehouse Type dropdown.

<figure><img src="/files/CRdd6xwif8qzwpxDsi8P" alt="" width="563"><figcaption><p>Required information for Athena connections</p></figcaption></figure>

### Information about required fields

1. **Name**
   * A user-friendly name used for display purposes in the Arcwise interface. Can be anything you want.
2. **AWS Access Key ID / Secret Access Key**
   * An access key ID / secret pair for the role that should run the Athena queries. The IAM role must have access to Athena and S3. <https://docs.aws.amazon.com/IAM/latest/UserGuide/id_credentials_access-keys.html>
3. **Region**
   * The AWS region that Athena will run in (e.g. `us-west-2`)
4. **Catalog**
   * The catalog (normally this should just be the default: `awsdatacatalog`). <https://docs.aws.amazon.com/athena/latest/ug/understanding-tables-databases-and-the-data-catalog.html>
5. **S3 Staging Directory**
   * Athena requires a S3 bucket path to store the results of queries. The access key / secret must have write access to this bucket. *NOTE: you may want to set up the bucket lifecycle to automatically purge old query results automatically. Arcwise doesn't require past query results to be accessible.*

### **Checking indexed tables/views**

Arcwise will automatically index your data catalog upon the initial connection; our index will also automatically refresh every day at midnight PST.

Go to the [Tables page](https://admin.arcwise.app/#/warehouse_entities) in the Arcwise panel to see the list of indexed tables / views.

To manually re-index tables, you can press the "Sync" button back on the [Connections page](https://admin.arcwise.app/#/warehouse_connections).


# S3

Arcwise supports any S3-compatible storage bucket as a destination for file uploads or third-party integrations. See [Connecting to Integrations](/arcwise-setup/integrations/overview) for more details (Arcwise will create a Parquet file every time you pull data from an integration like Salesforce or Hubspot).

## Add S3 credentials in Arcwise

1. Log into the Arcwise Admin portal and [set up users/roles for your team first](/arcwise-setup/user-and-role-management).
2. Go to the “Connections” tab in the Arcwise admin panel (<https://admin.arcwise.app/#/warehouse_connections>)
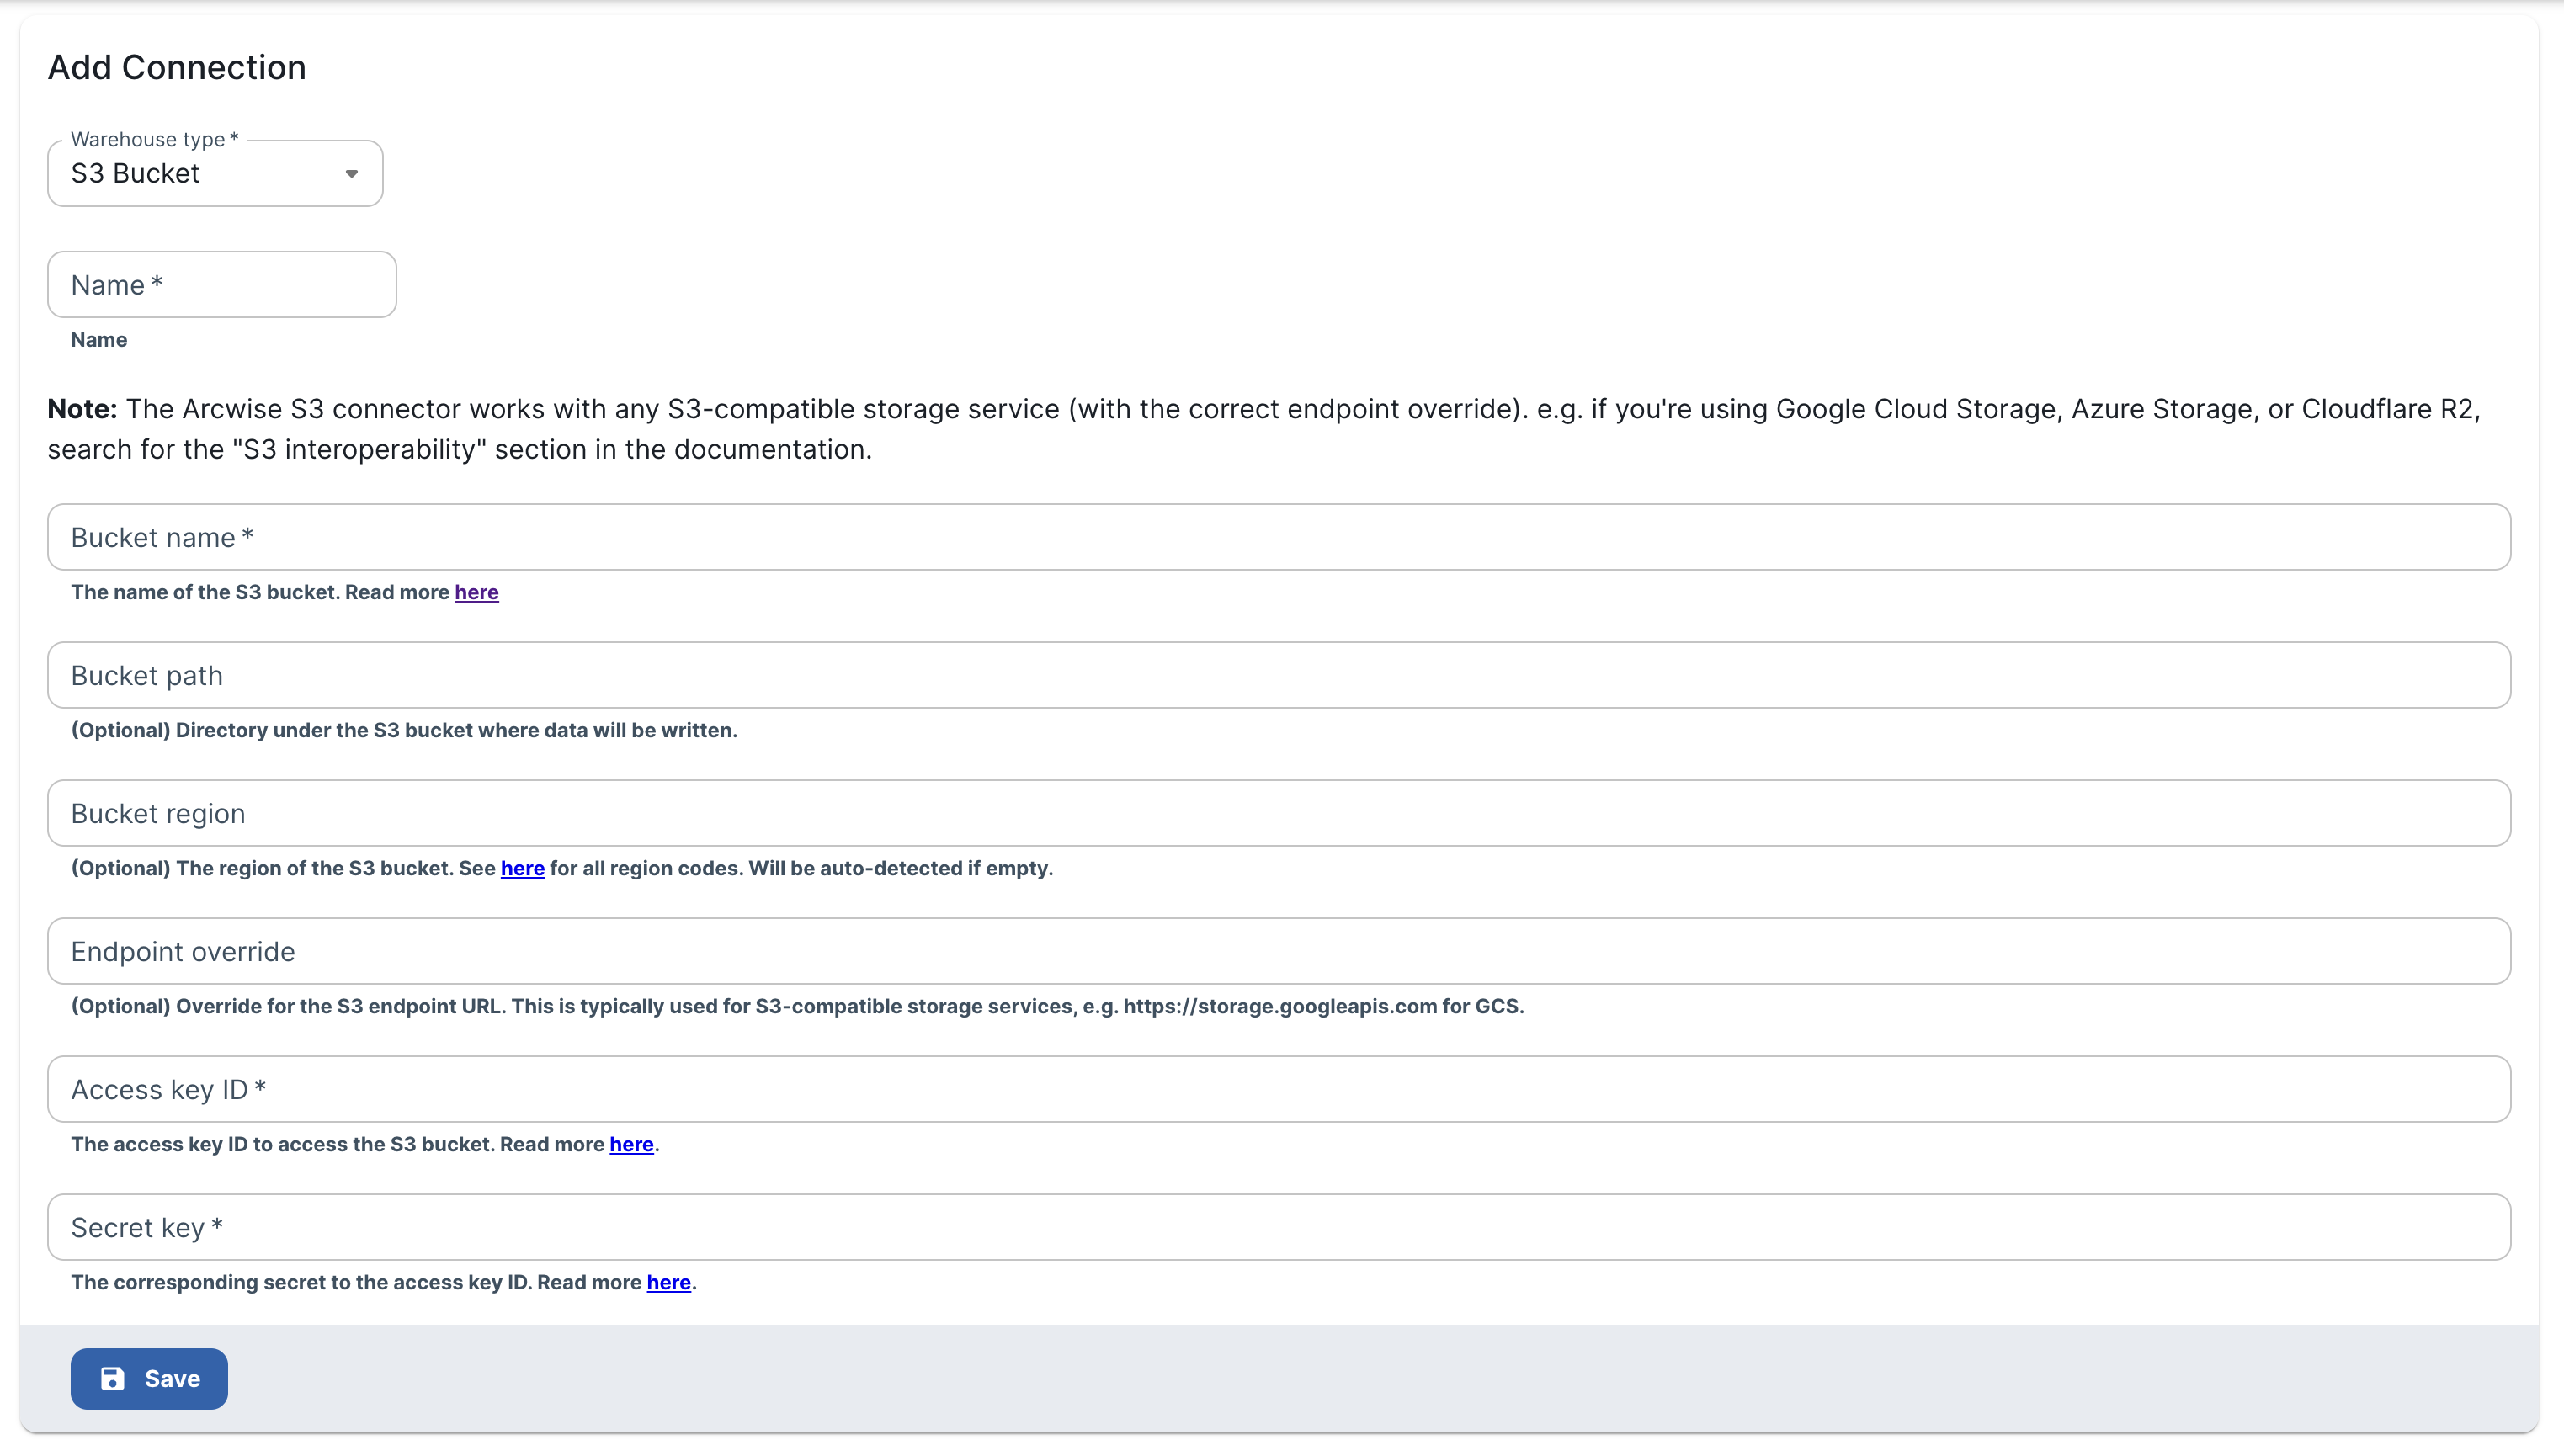
3. Click on the “+ Create” button (top-right) and select "S3" from the Warehouse Type dropdown.
4. (Optional) Toggle ON the “Use as file upload connection” to use this connection for file uploads. When this is enabled, this connection should be used exclusively for uploads.

<figure><img src="/files/LKOqg7LwiOKDyJNGR5nK" alt=""><figcaption></figcaption></figure>

### S3 compatibility for other clouds

Almost all the major cloud storage bucket solutions are S3-compatible. Here are some links for the major cloud providers:

* [Google Cloud Storage](https://cloud.google.com/storage/docs/interoperability) - set up an HMAC key and use `https://storage.googleapis.com` as the endpoint override
* [Cloudflare R2](https://developers.cloudflare.com/r2/api/s3/api/)
* Azure Storage currently doesn't have a built-in S3 compatibility layer, but there are [open source proxy](https://github.com/gaul/s3proxy) solutions.


# Connecting data tools


# Connect to dbt

Once you’ve set up the initial data warehouse connection, you can add dbt jobs linked to the warehouse account.

{% hint style="info" %}
**NOTE:** this requires `Job Viewer` role access to a dbt Cloud account.
{% endhint %}

## Adding DBT

1. In the **Connections** tab, click on the connection that should have linked dbt jobs.
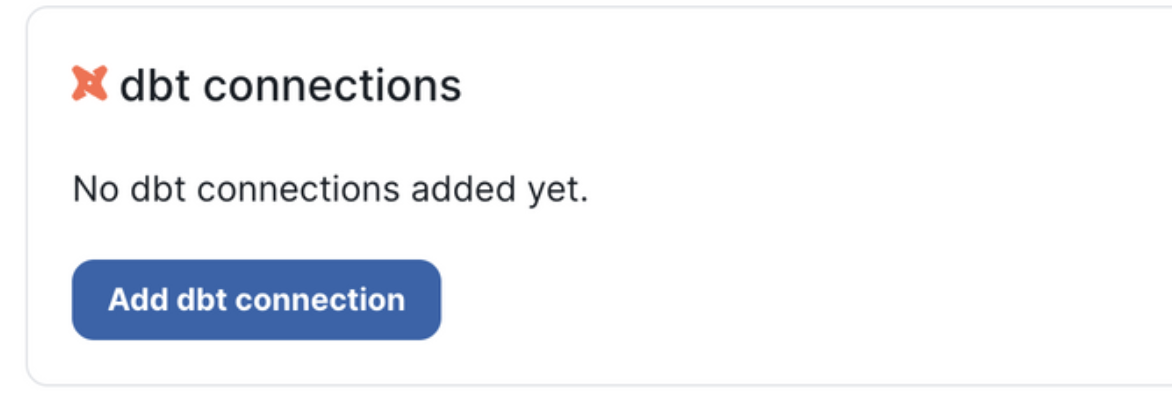
2. Go to the **dbt connections** section and click the **Add dbt connection** button.<br>

   <figure><img src="/files/ut6giCEOYcJCSC7fQaE3" alt="" width="375"><figcaption></figcaption></figure>
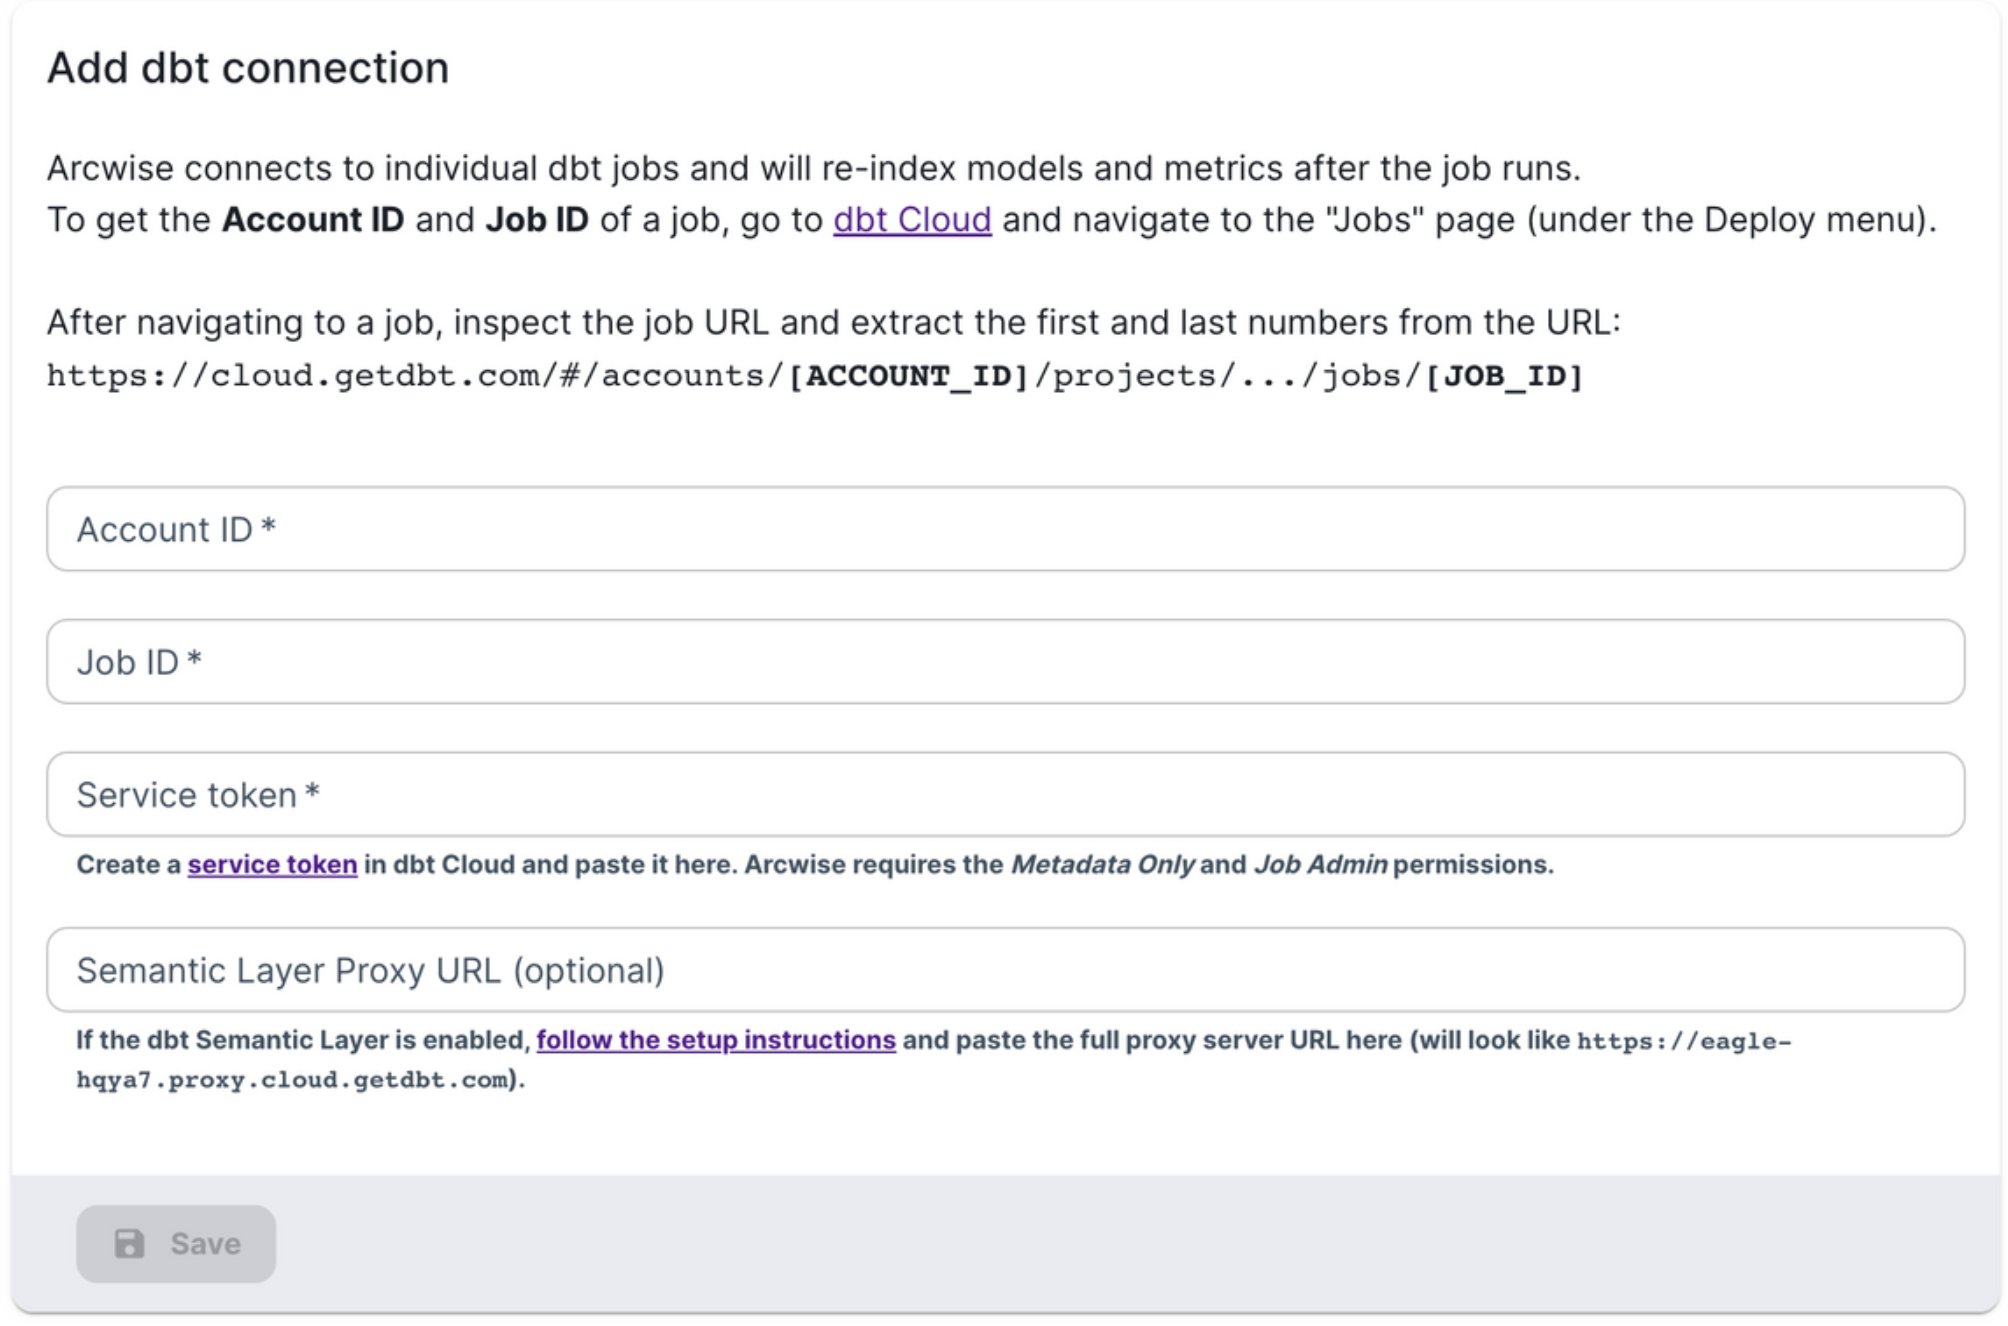
3. Fill in the form with the required details. See below for additional details.<br>

   <figure><img src="/files/dOi9eFdBs4jxticmE1Fc" alt=""><figcaption></figcaption></figure>

## Form Details

<details>

<summary>Account and job ID</summary>

In dbt Cloud, navigate to the **Jobs** list under the **Deploy** menu. Click on the job that you want to connect to Arcwise (if you have multiple jobs, please select the job that builds your dbt docs, i.e. it includes a dbt docs generate step). The URL should be in the form&#x20;

`https://cloud.getdbt.com/next/deploy/[ACCOUNT-ID]/projects/[PROJECT_ID]/jobs/[JOB_ID]`

Copy and paste the account and job numbers into the Arcwise form.

![](/files/8cBeat3xgi5YitlCmzI3)

</details>

<details>

<summary>Service token</summary>

See instructions in [dbt docs for generating a service token](https://docs.getdbt.com/docs/dbt-cloud-apis/service-tokens). The token must have access to both the **Metadata API** and **Job Admin**.

</details>

<details>

<summary>Semantic Layer Proxy URL</summary>

If you want to allow Arcwise to use [dbt metrics](https://docs.getdbt.com/docs/build/metrics), then you’ll need to link Arcwise to the dbt Semantic Layer. Follow the [semantic layer setup instructions from the dbt docs](https://docs.getdbt.com/docs/use-dbt-semantic-layer/setup-dbt-semantic-layer) (if you haven’t already) and paste the proxy URL from your job’s environment into Arcwise.

</details>

## Indexing

After the dbt connection has been successfully saved, navigate to the “Tables” tab and you should see the models and metrics belonging to your dbt job.

{% hint style="info" %}
By default, Arcwise will index all models and metrics linked to the job that have not been marked as hidden from dbt docs. To hide things from Arcwise, you can set the `docs` config to `show: false` - please see the [official dbt docs](https://docs.getdbt.com/reference/resource-configs/docs#mark-a-model-as-hidden) for how to do this for an individual model or entire folders.
{% endhint %}


# Connect to Looker

{% hint style="info" %}

### Before you Begin

If you haven’t already, add users that will require access while setting up your data warehouse connection: [User & Role Management](/arcwise-setup/user-and-role-management)
{% endhint %}

## Creating Service Account in Looker Admin

Complete the steps below to create a Service Account in Looker using a Looker admin account.  \
\
This step is only necessary if you do not already have a Service Account set up in Looker.  If you already do, you can skip ahead to [#configuring-service-account-in-looker-admin](#configuring-service-account-in-looker-admin "mention")

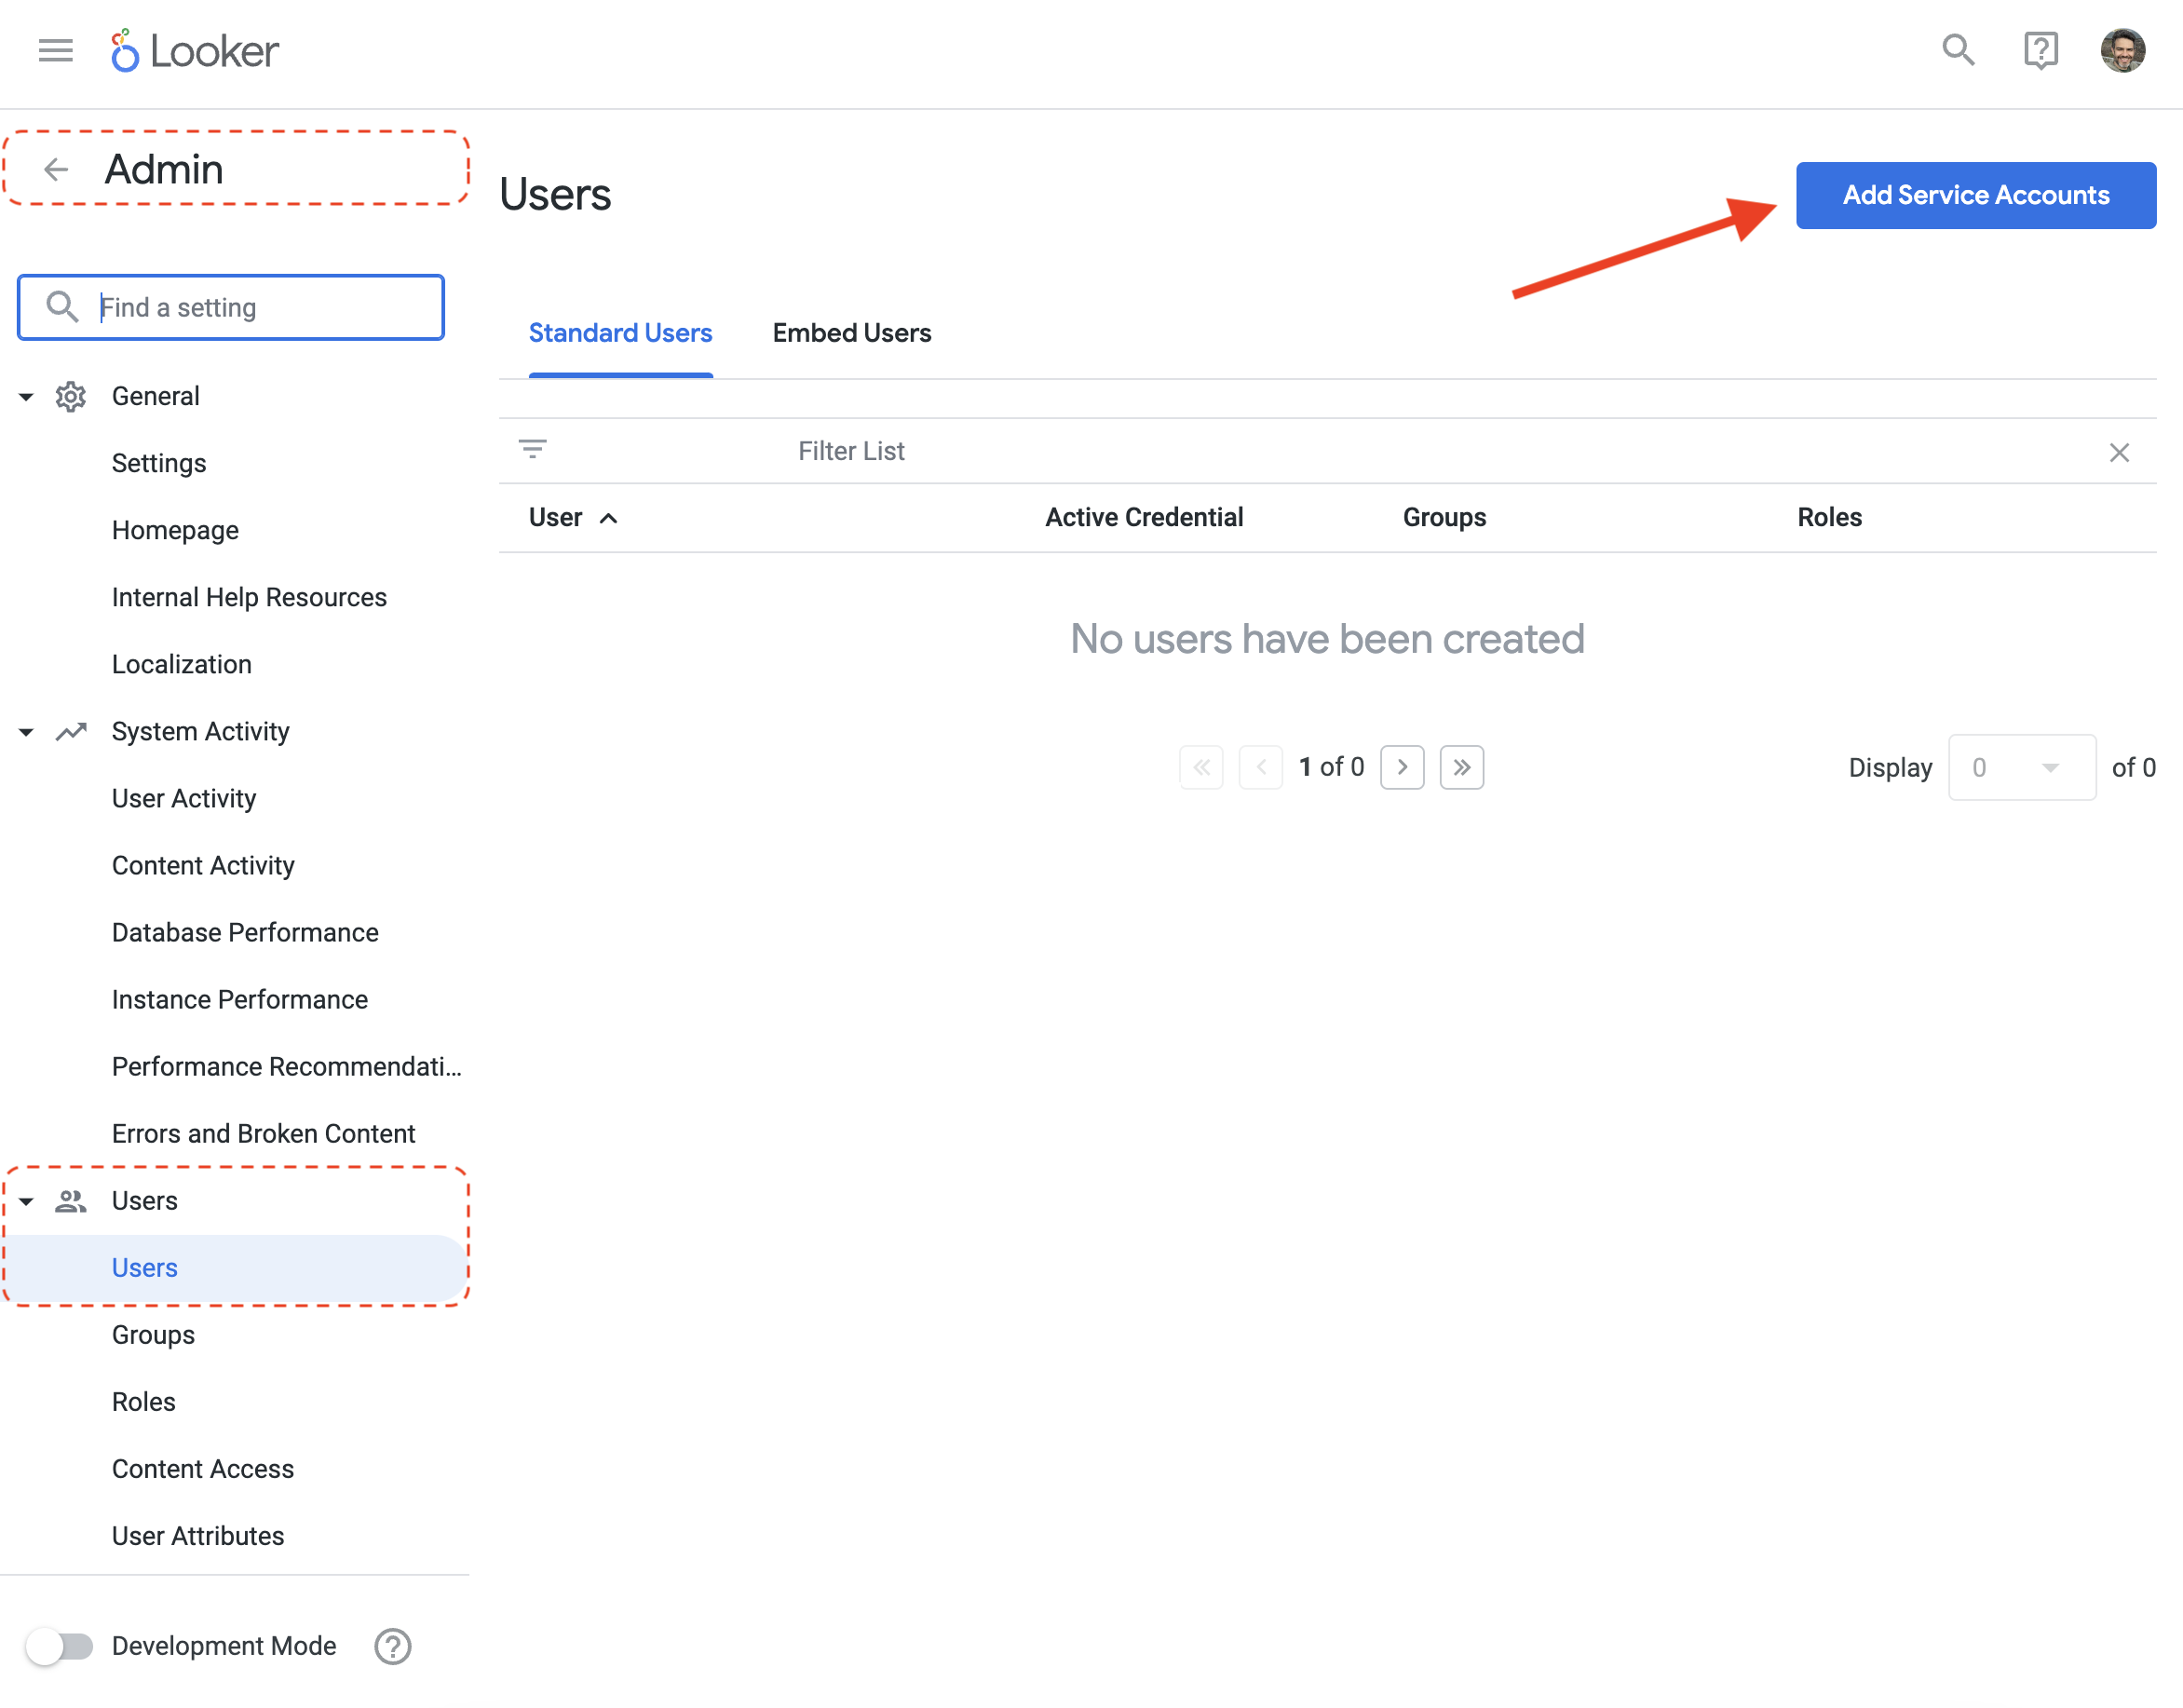
1. On the left-side options, select Admin > Users to go to the User Admin panel and select Add Service Accounts on the top right (see screenshot below).

   <figure><img src="/files/3ThSPiDeW8CwjH982jzN" alt=""><figcaption></figcaption></figure>
2. On the next screen, add an email for the Service Account and make sure they have the role of "Admin".  After creation, you should be dropped into a User edit view, like the one shown in the section below. &#x20;

## Configuring Service Account in Looker Admin

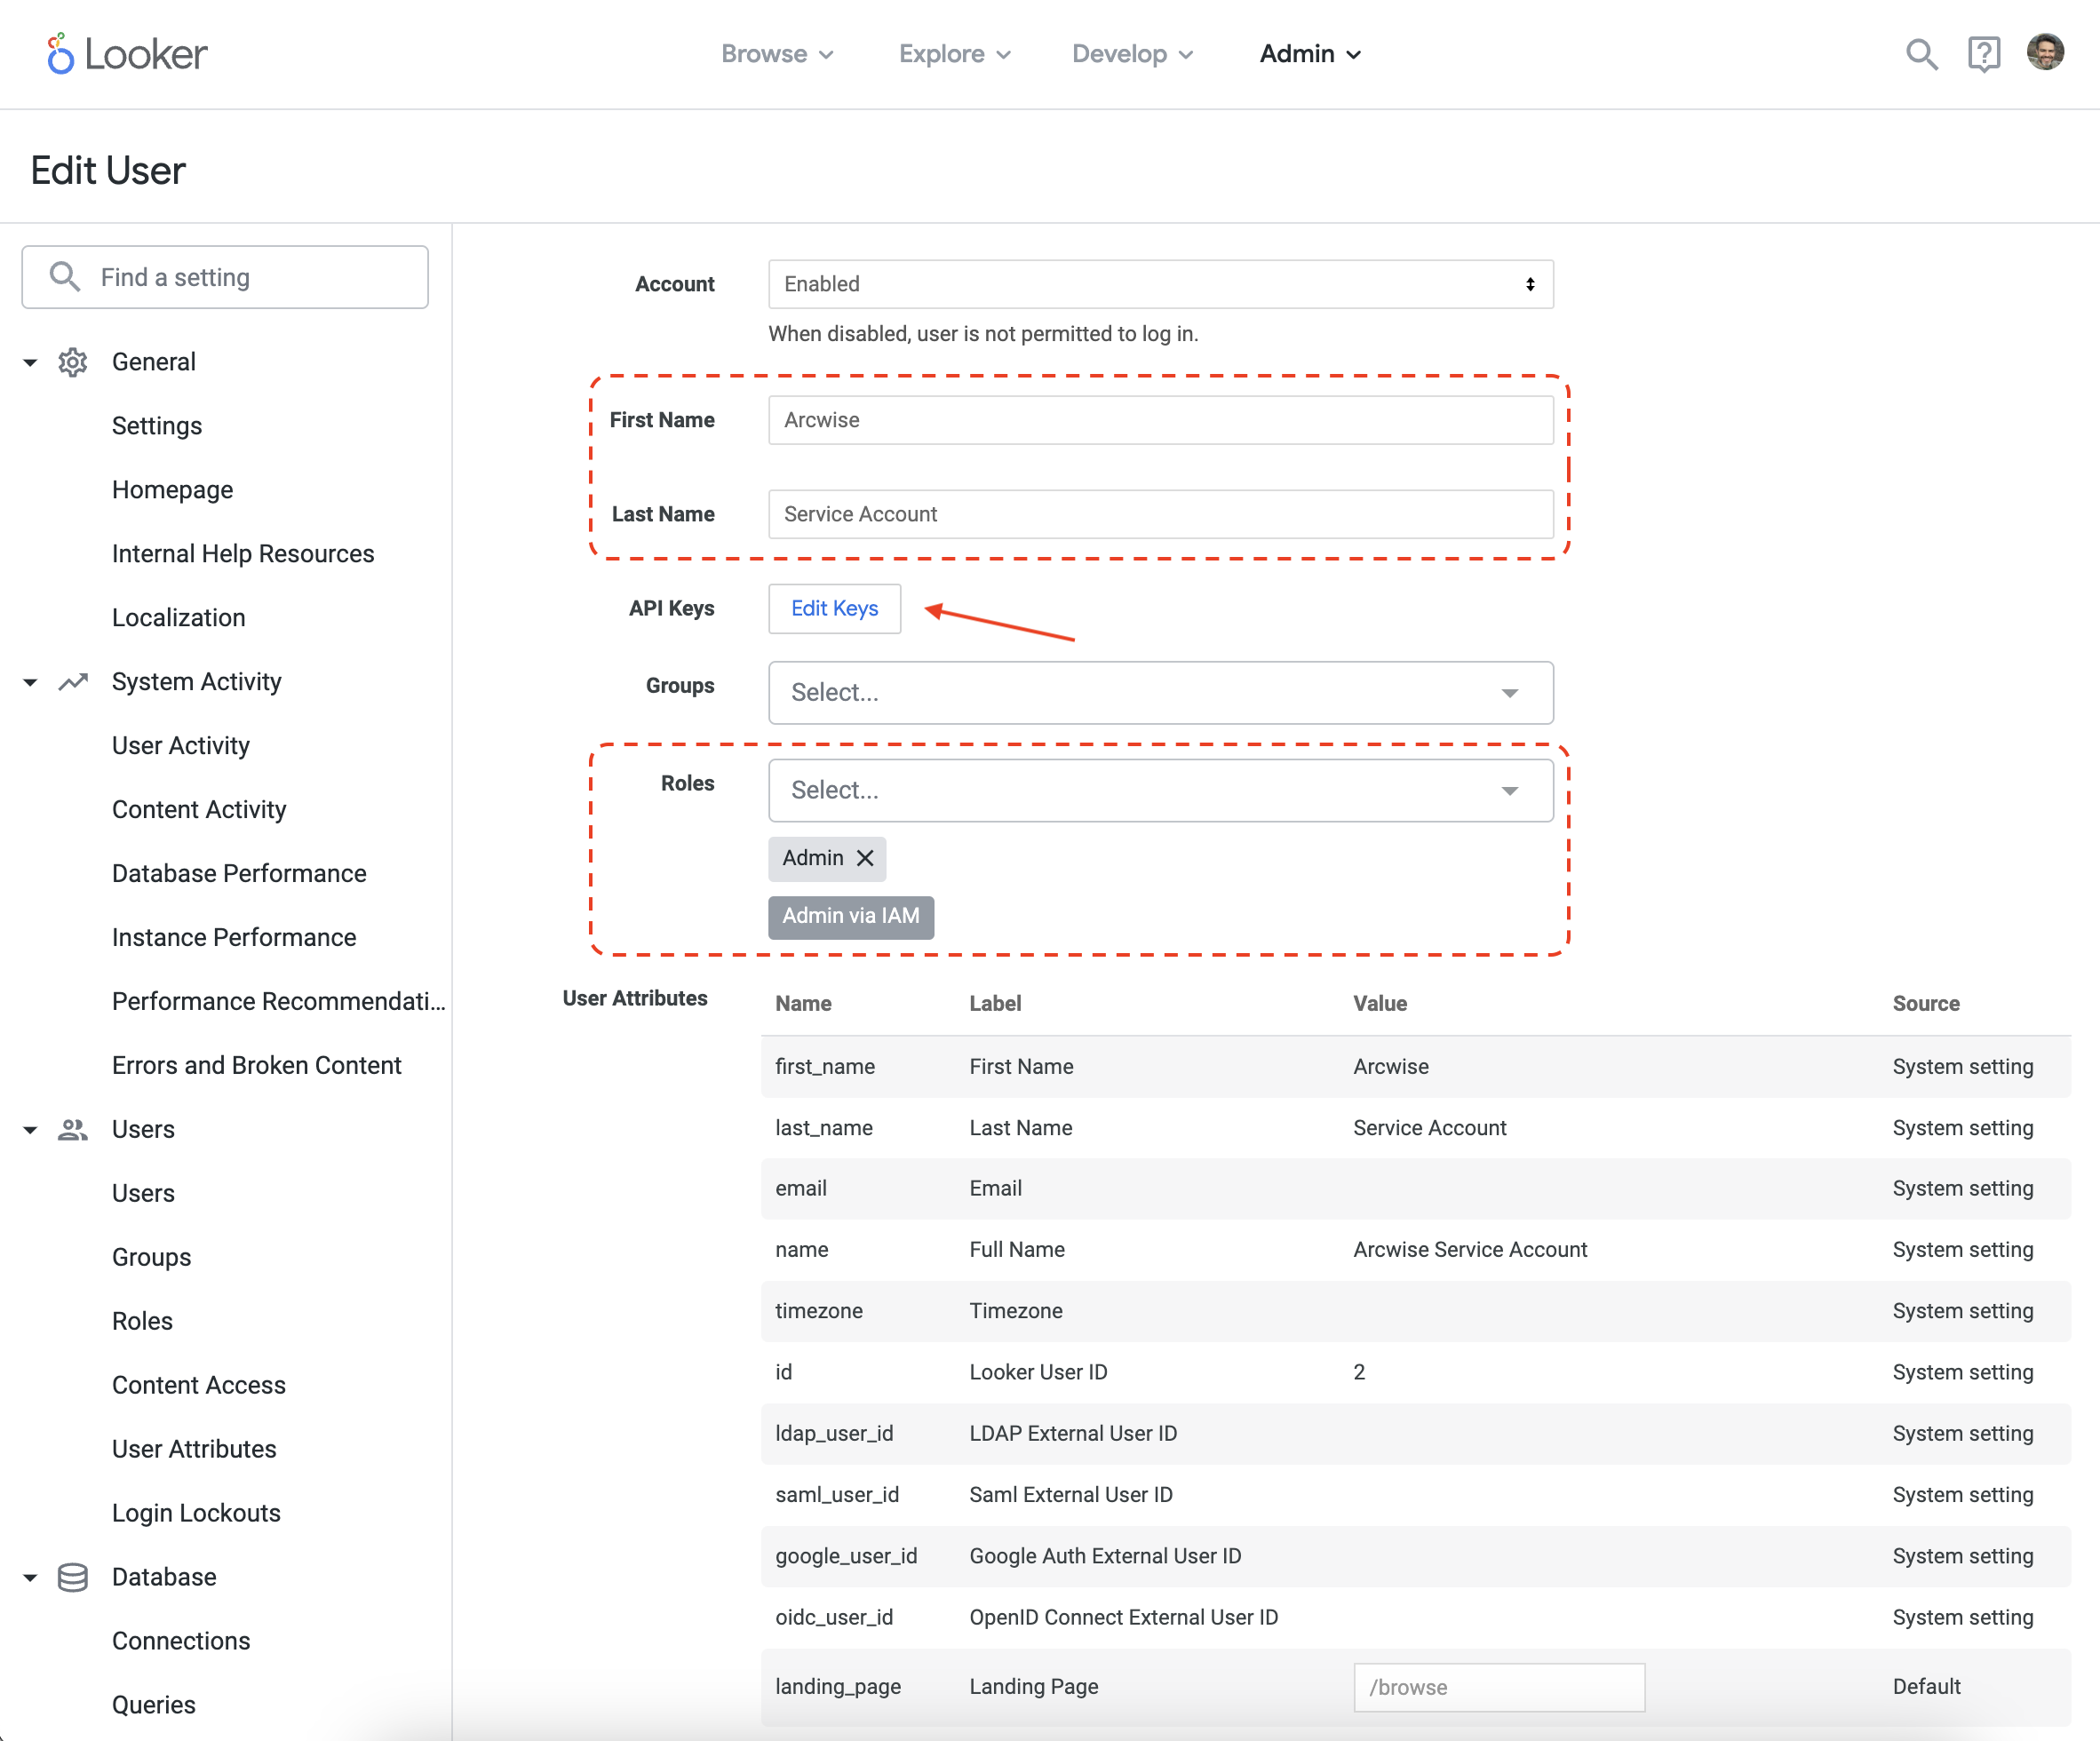
1. Go to edit the Service Account user account in Looker.  If the service account doesn't already have a name, fill out the first and last name to "Arcwise Service Account" as shown below and confirm that the "Admin" role is added in the Roles section.

<figure><img src="/files/v9mkaSK0EVOthNQ3hYg8" alt=""><figcaption></figcaption></figure>

2. Click on the API Keys "Edit Keys" option, highlighted with an arrow above.
3. On the next screen, click "New API Key". This will create a new key that will be used in the following section.

## Adding Looker in Arcwise Admin

1. Navigate to <https://admin.arcwise.app/> and go to the **Integrations** tab.
2. Click the "Create" button and select "Looker" as the integration type.
3. Fill in the form with the required details using the API Key you created above. See below for additional details.

## Form Details

<details>

<summary>Host URL</summary>

Your Looker URL is probably of the form <https://yourcomany.looker.com> or <https://something-random.looker.app>.  \
\
The Host URL needed here is just the root `yourcompany.looker.com` or `something-random.looker.app` part.

</details>

<details>

<summary>Client ID</summary>

This is the Client ID associated with the API Key that was generated in Looker above.

</details>

<details>

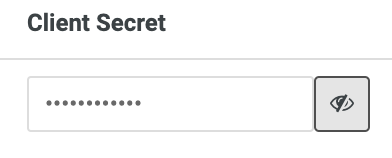
<summary>Client Secret</summary>

This is the Client Secret associated with the API Key that was generated in Looker above.  \
\
You will need to click the eye icon to the right to be able to copy/paste the Client Secret into the Arcwise admin window.

<img src="/files/1voiuFzfVx3A9gVWqdiR" alt="" data-size="original">

</details>

## Connection test

Before the Looker connection has been saved in Arcwise, it will run a test to ensure connectivity. Please note if there are any errors.  If it is able to save the record successfully, you will see it appear in <https://admin.arcwise.app/#/api_connections>.

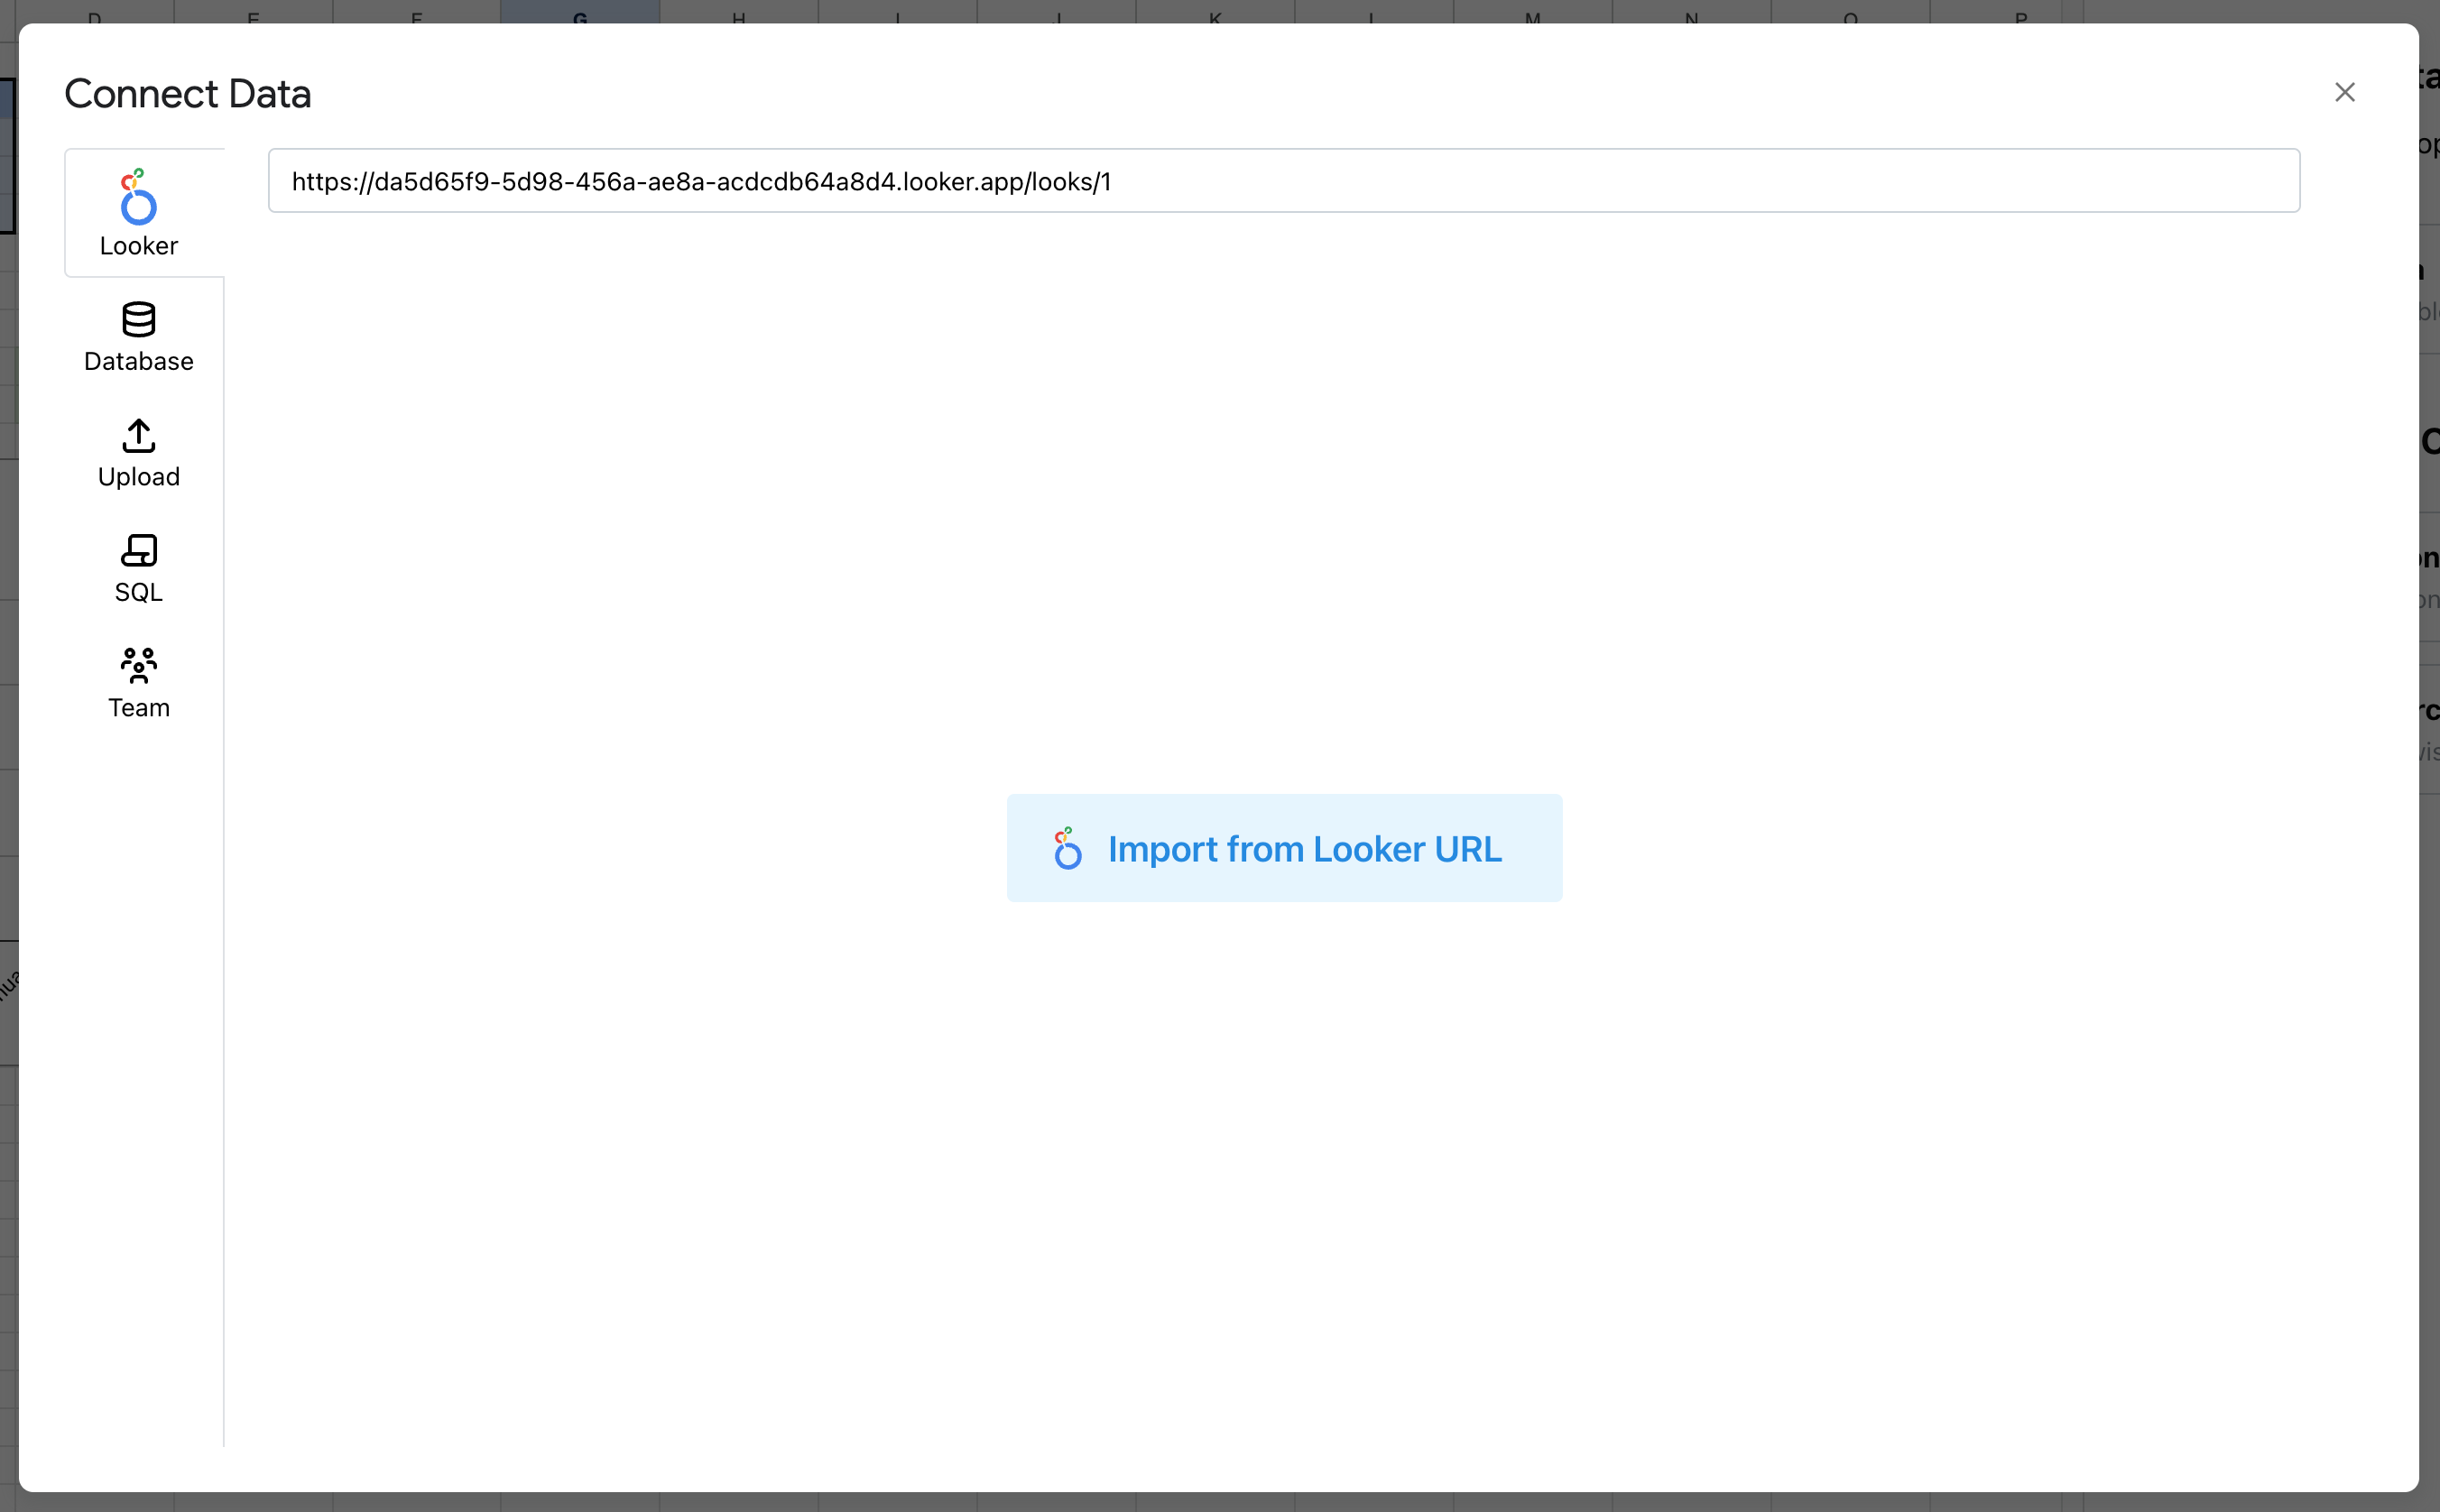
Now, if you open the Arcwise sidebar in a Google Sheet and click "Connect Data", you should be able to paste in a Looker Look URL and import its data:

<figure><img src="/files/IGjFDfh3FtCSA9hElQup" alt=""><figcaption></figcaption></figure>


# Connect to Cube

Arcwise connects to the [Cube SQL API](https://cube.dev/docs/product/apis-integrations/sql-api) and allows end-users to query public views (and metrics within views).

## Setting up the Cube connection

1. In the Arcwise admin panel, [create a new connection](https://admin.arcwise.app/#/warehouse_connections/create) and select Cube.dev as the warehouse type.
2. The "Name" can be anything you want (preferably something user-friendly.)
3. Enter your Cube credentials below (can either be a Cube Cloud or self-hosted deployment). Information for an example Cube Cloud instance can be seen below.

<figure><img src="/files/H1eZTzvRTLLDqoJP3oYB" alt="" width="375"><figcaption></figcaption></figure>

4. If everything is successful, the[ "Tables" tab](https://admin.arcwise.app/#/warehouse_entities) should display a list of your Cube views. (We also pull out each *measure* associated with a view so that users can query them through formulas, as shown below).

{% hint style="info" %}
Support for [security contexts](https://cube.dev/docs/product/auth/context), particularly at the user level, is still under development.
{% endhint %}

#### (Optional) Configuring the AI Analyst

If you want to make best use of the AI Analyst, head to the [AI tab](https://admin.arcwise.app/#/ai) in the Arcwise admin panel to configure some settings:

1. By default, the AI will only query tables that have been explicitly connected to a spreadsheet. You can add patterns in the "Table patterns to auto-include in AI conversations" setting to configure tables/views that should be automatically available to the AI.
2. The "Table metadata" section can be used to add additional context/descriptions at the view & column level to the AI.
3. The "Additional system prompt" can be used to add global context to each AI conversation.

## Using cubes in Arcwise

Arcwise offers three primary ways to work with data from Cube.

### Pivoting a Cube view

Open the Arcwise extension in Google Sheets and click "Connect Data" to open a browser of all connected data sources. You should be able to find your Cube views by searching the "Database" tab:

<figure><img src="/files/xqHAU6ZwHaqh0mORAqHa" alt="" width="563"><figcaption></figcaption></figure>

After clicking on your view, the right pane displays a list of public dimensions and measures.

{% hint style="info" %}
The preview and connect buttons will directly pull the (ungrouped) data in the view. This usually isn't what you want to do.
{% endhint %}

Clicking the "Pivot" button will pull up a pivot table UI where you can freely move dimensions to rows/columns and measures (green) to values:

<figure><img src="/files/BG0dQVQ5IM7mSWs1ShDg" alt=""><figcaption><p>A basic pivot table on an orders cube, showing Order Count by Product Category vs. Status.</p></figcaption></figure>

Clicking "Connect" will save the pivot table into the spreadsheet.

Users can also change the "Chart type" at the top right to easily visualize the data in the pivot table as a bar, line, scatter, area, or pie chart:

<figure><img src="/files/M2XKH7Z84wqWcvLTgTuf" alt=""><figcaption><p>Bar chart view of the pivot table.</p></figcaption></figure>

Clicking "Save" will save the visualization into the spreadsheet; users can bring up the visualization editor again by simply double-clicking on the saved visualizations.

#### Editing a saved pivot table

Once saved in the sheet, there are a few features to call out:

<figure><img src="/files/sYRIC5ONYC9BImkTU9vb" alt=""><figcaption><p>Saved Cube pivot in a Google Sheet</p></figcaption></figure>

First, the inline overlay within the sheet tab displays a few key actions (from left-to-right: "Edit", "Analyze", "Refresh", "Drilldown".)

<figure><img src="/files/dPMKaAd8gg4GcZfVfh95" alt="" width="163"><figcaption></figcaption></figure>

* **Edit**: Brings up the overlay on the right, which allows the pivot fields to be edited. You can also add new "table calculation" formulas under the "Additional fields" section at the bottom.
  * (In the screenshot, "completion\_rate" is defined as a table calculation formula: `completed_count / order_count`)
  * See more here: [Arcwise Connected Data](/using-arcwise-in-sheets/arcwise-connected-data)
* **Analyze**: Opens up the AI Analyst, focused on the current pivot. See more at [Using AI Analyst in Sheets](/using-arcwise-ai-analyst/using-ai-analyst-in-sheets)
* **Refresh:** Re-runs the query and updates the contents of the current spreadsheet tab.
* **Drilldown:** If the selected spreadsheet cell is a pivot **value**, the drilldown view shows the ungrouped rows in the cube that match the filters defined by the rows and columns.

### Running metric formulas

In any spreadsheet cell, typing `=$` will show a list of public **measures** exposed by any Cube view:

<figure><img src="/files/NBxNiSRxMwwjMhw2R8cs" alt="" width="375"><figcaption><p>Metric formula autocompletion</p></figcaption></figure>

Here is an example of a complete formula that queries the **Order Count** measure where the **status** dimension is equal to A1 and the **created\_at** column is after B1:

```
=$orders_cube.order_count("status", $A1, "created_at", ">"&B$1)
```

* Each measure is available as a spreadsheet function `$view_name.measure_name`.
* If no parameters are provided, the measure is queried over all rows (usually not desirable.)
* Otherwise, parameters should come in pairs:
  * The 1st, 3rd, 5th, ... parameters should be the string **dimension name** associated with the measure's view. (A list of suitable dimensions will be displayed in the autocompletion menu.)
  * The 2nd, 4th, 6th, ... parameters will be used as the comparison value for the immediately preceding dimension.
    * If the comparison is a string, COUNTIF/SUMIF criteria syntax is supported, i.e. you can pass in `"<X", ">X", "<=X", "<>X"` to compare the specified dimension against a certian value.
    * You can even pass in **ranges** as the comparison value (e.g. `A1:A10`) for the result of the metric formula to be an **array** of values. (Careful that in Google Sheets, you'll need to use the [`ARRAYFORMULA` function](https://support.google.com/docs/answer/3093275?hl=en) if you want to chain computations on top of the function result, e.g. `=ARRAYFORMULA($orders_cube.order_count(...) + 1)`

**IMPORTANT**: Arcwise formulas (including measure formulas) deviate from normal spreadsheet formulas in that their values **do not update automatically, even when dependencies change.** This is to protect against cascading updates overwhelming your database, and to make sure that cell values do not dynamically change without explicit user interactions.

See [Using Formulas in Sheets](/using-arcwise-in-sheets/formulas) for an overview of how to refresh Arcwise formulas.

### Using the AI analyst

See [Using AI Analyst in Sheets](/using-arcwise-ai-analyst/using-ai-analyst-in-sheets) for more details. The Arcwise AI analyst knows how to automatically generate **pivot tables** for Cube data (and visualizations based off those pivot tables) - you'll generally want to make sure that your Cube views are auto-included (see [#optional-configuring-the-ai-analyst](#optional-configuring-the-ai-analyst "mention") above.)

<figure><img src="/files/wnJu8RiX8RKOvGHHH5XY" alt="" width="375"><figcaption></figcaption></figure>


# Audit logging

The Arcwise admin panel exposes a [Logs tab](https://admin.arcwise.app/#/event_history) which shows relevant changes to warehouse connections, API integrations, user roles, and more. Audit logs can also be exported as a CSV.

<figure><img src="/files/DCiaAbvoyNIoaNT0WlfG" alt=""><figcaption></figcaption></figure>

### Logged events

Here is a (non-complete) list of events currently logged by Arcwise:

<table><thead><tr><th width="293">Event / Action</th><th>Description</th></tr></thead><tbody><tr><td>reindex_warehouse_all</td><td>Occurs nightly when Arcwise automatically re-indexes your warehouse. A failure event will be logged if any errors are encountered.</td></tr><tr><td>create_warehouse_connection<br>update_warehouse_connection</td><td>Logged when a new warehouse connection is created or one is updated.</td></tr><tr><td>create_role<br>delete_role<br>edit_role</td><td>Logged when a new user is added, deleted, or their permissions are edited</td></tr><tr><td>create_token<br>delete_token</td><td>Logged when a Personal Access Token is created or deleted by a user.</td></tr></tbody></table>

### Accessing audit logs via API

Arcwise's audit logs can be accessed via API. First, you'll need an administrator to create an API key ("personal access token").

#### Obtaining a Personal Access Token

1. Log into <https://admin.arcwise.app/>
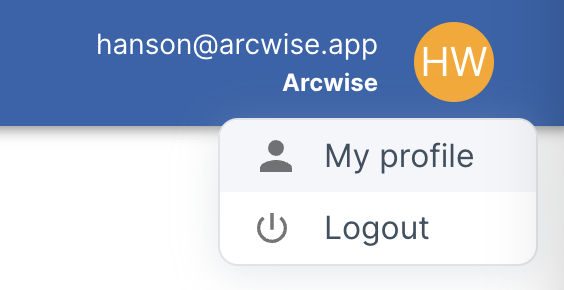
2. Click your email / initials at the top right and select "My profile".

   <div align="left"><figure><img src="/files/AY7mXY4vPMuH0pD16h2r" alt="" width="282"><figcaption></figcaption></figure></div>
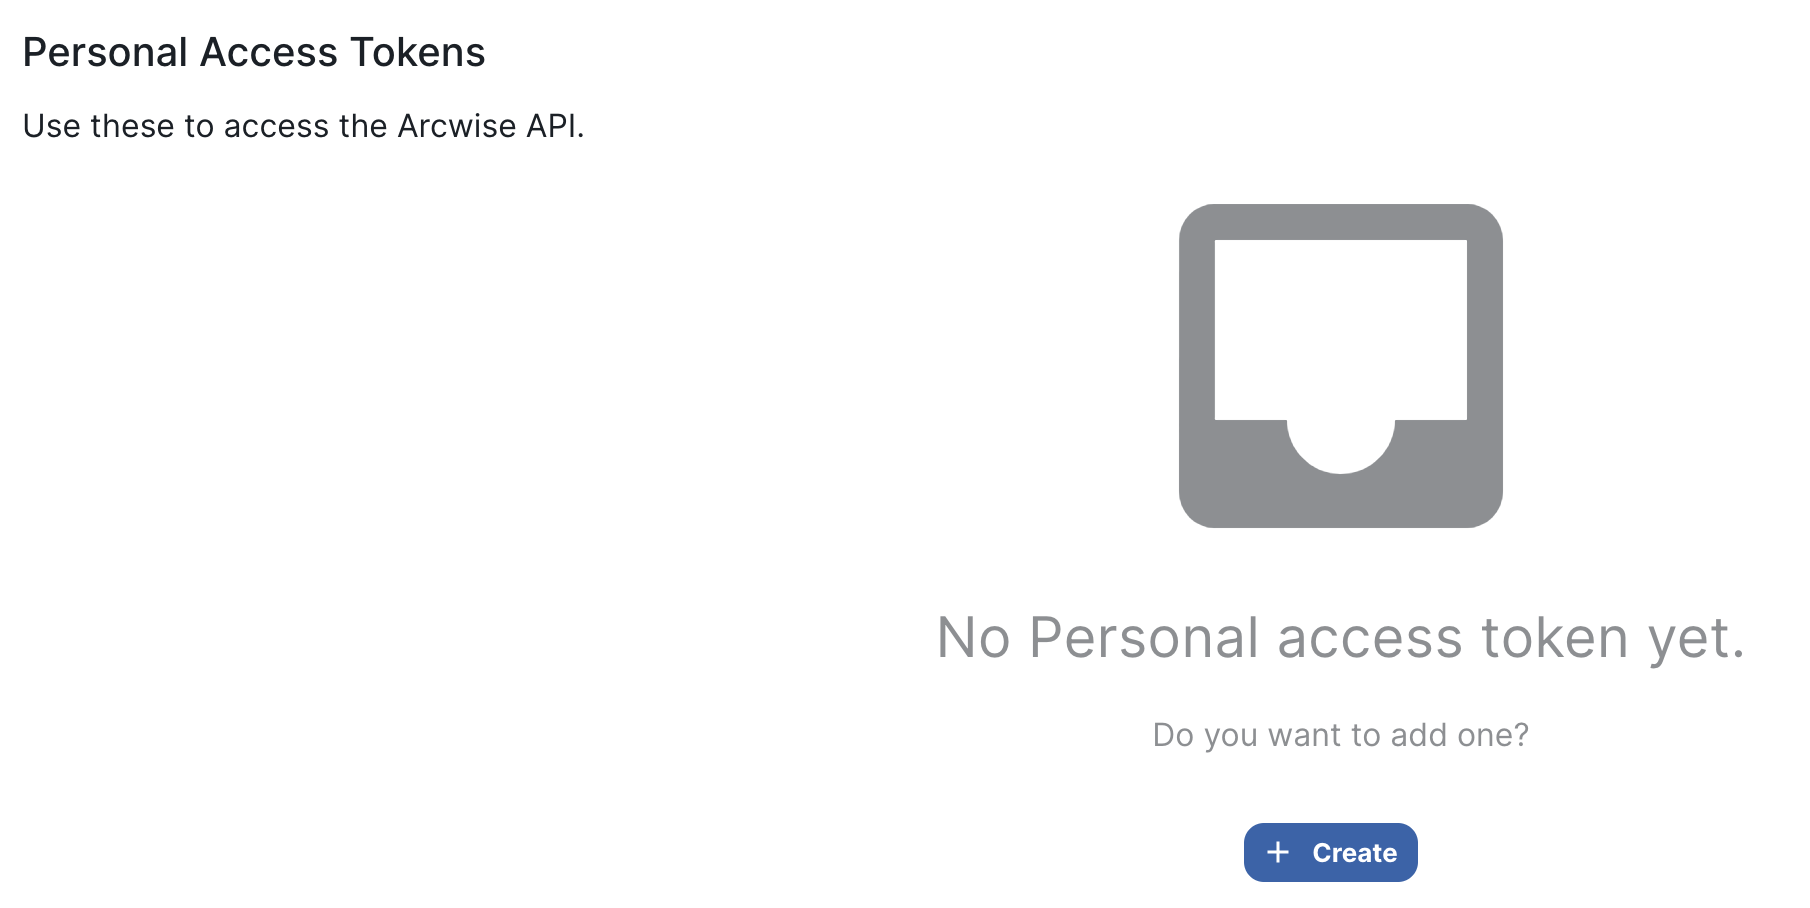
3. Scroll down to the "Personal Access Tokens" section and click "+ Create"

   <div align="left"><figure><img src="/files/dkQcxDJ5X9v8l8O82gNn" alt="" width="375"><figcaption></figcaption></figure></div>
4. Provide a name for your token (e.g. "audit\_logs") and hit "Save". Your new token should now appear in the table. Click the "copy" or "view" buttons to obtain your API token and save it to a secure location.\
   ![](/files/qtInij4H9oD2K3AS69DV)<br>
5. At any time, you can click the delete button to permanently revoke a token, at which point it will immediately lose access to Arcwise.

#### Make an HTTP request to access the event logs

Now, you can make a HTTP GET request to <https://backend.arcwise.app/api/event_history> to obtain a JSON list of all log entries within a certain timeframe.

* Set the `Authorization` header to `Bearer: <your personal access token>` to   authenticate with this endpoint.
* You can optionally pass in the following query parameters through the URL:

| Parameter        | Description                                                                                  |
| ---------------- | -------------------------------------------------------------------------------------------- |
| `from_timestamp` | A UNIX timestamp or ISO date/time string to specify the start time for retrieved event logs. |
| `to_timestamp`   | A UNIX timestamp or ISO date/time string to specify the end time for retrieved event logs.   |
| `limit`          | An integer indicating the maximum number of logs to return. (Default: 1000)                  |

* The output will be a JSON list where each entry is an object with the following keys:

<table><thead><tr><th width="210">Key</th><th>Description</th></tr></thead><tbody><tr><td><code>event</code></td><td>Name of the event (e.g. <code>add_role</code>, <code>edit_role</code>, <code>delete_role</code>)</td></tr><tr><td><code>message</code></td><td>A description of the event with more details. (may be null)</td></tr><tr><td><code>timestamp</code></td><td>The UNIX timestamp when the event took place.</td></tr><tr><td><code>severity</code></td><td>One of <code>info</code>, <code>warning</code>, or <code>error</code>.</td></tr><tr><td><code>user_id</code></td><td>The Arcwise user ID that initiated the event (may be null)</td></tr></tbody></table>

**Example cURL API request/response**

```basic
# Request
curl 'https://backend.arcwise.app/api/event_history?limit=1&from_timestamp=1700000000' \
  -H 'Authorization: Bearer 12345678-9012-3456-7890-123456789012' -X GET

# Response: 200 OK
[
  {
    "event": "create_token",
    "timestamp": 1706599957,
    "severity": "info",
    "message": "User 0000-1111-2222 created personal access token 3333-4444-5555",
    "user_id": "0000-1111-2222"
  }
]
```


# Integrations


# Overview

Arcwise also has the ability to pull data via integrations with third-party software services (e.g. Salesforce, Hubspot, etc). Follow the subpages for information on each one.

One important thing to note: **Arcwise requires an attached database or data warehouse connection for each integration**. This is so that we can store persistent snapshots of your data, allowing efficient scheduled refreshes (without having to re-sync everything every time.)

Refer to the [Connect Data Warehouse](/arcwise-setup/connect-data-warehouse) section for information on connecting a data warehouse. We support saving data into any [S3-compatible storage bucket](https://aws.amazon.com/s3/), which you can set up on all of the major cloud providers. We're also happy to set one up on your behalf 😊

* If you're comfortable with storing the data in an Arcwise-managed storage bucket, you can also select "File Uploads" as the destination warehouse. This will store imported data alongside  any CSV files you've uploaded to Arcwise (see:[Uploading CSV Files](/connecting-data/uploading-csv-files))


# Hubspot

### Connecting to Hubspot

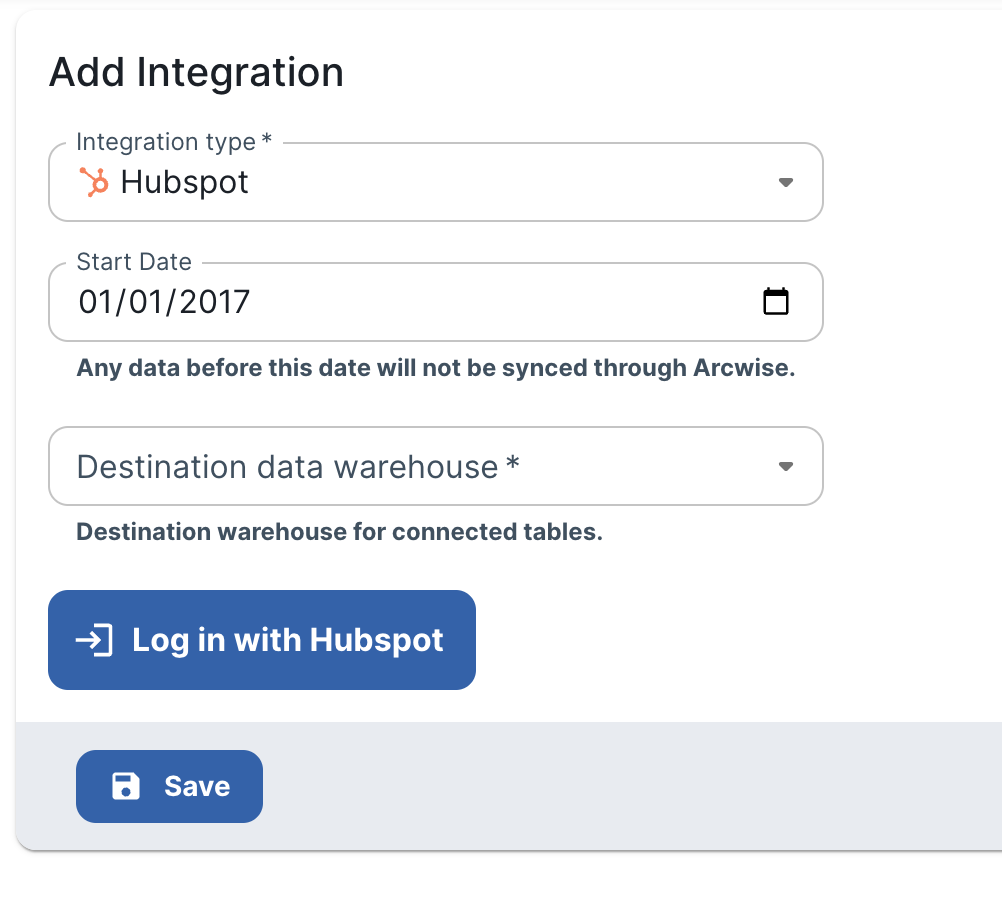
1. Go to <https://admin.arcwise.app/#/api_connections> and click the "+ Create" button.
2. Select "Hubspot" from the dropdown.
3. Select a data warehouse (where Arcwise will store snapshots). See [Overview](/arcwise-setup/integrations/overview) for more information. You can also connect an [S3](/arcwise-setup/connect-data-warehouse/s3) bucket.
   1. For the "Destination schema", the easiest option is to use the snapshot schema linked to the warehouse (e.g. `_arcwise_snapshots`. *Warning: this may be case-sensitive!*). You can also create a new schema if it's preferable.
4. Click the "Log in with HubSpot" button and enter your Hubspot login details. It may take a few minutes to sync the available set of tables.<br>

   <figure><img src="/files/uTik5TO0Ar9G1eMGLKzP" alt="" width="375"><figcaption></figcaption></figure>
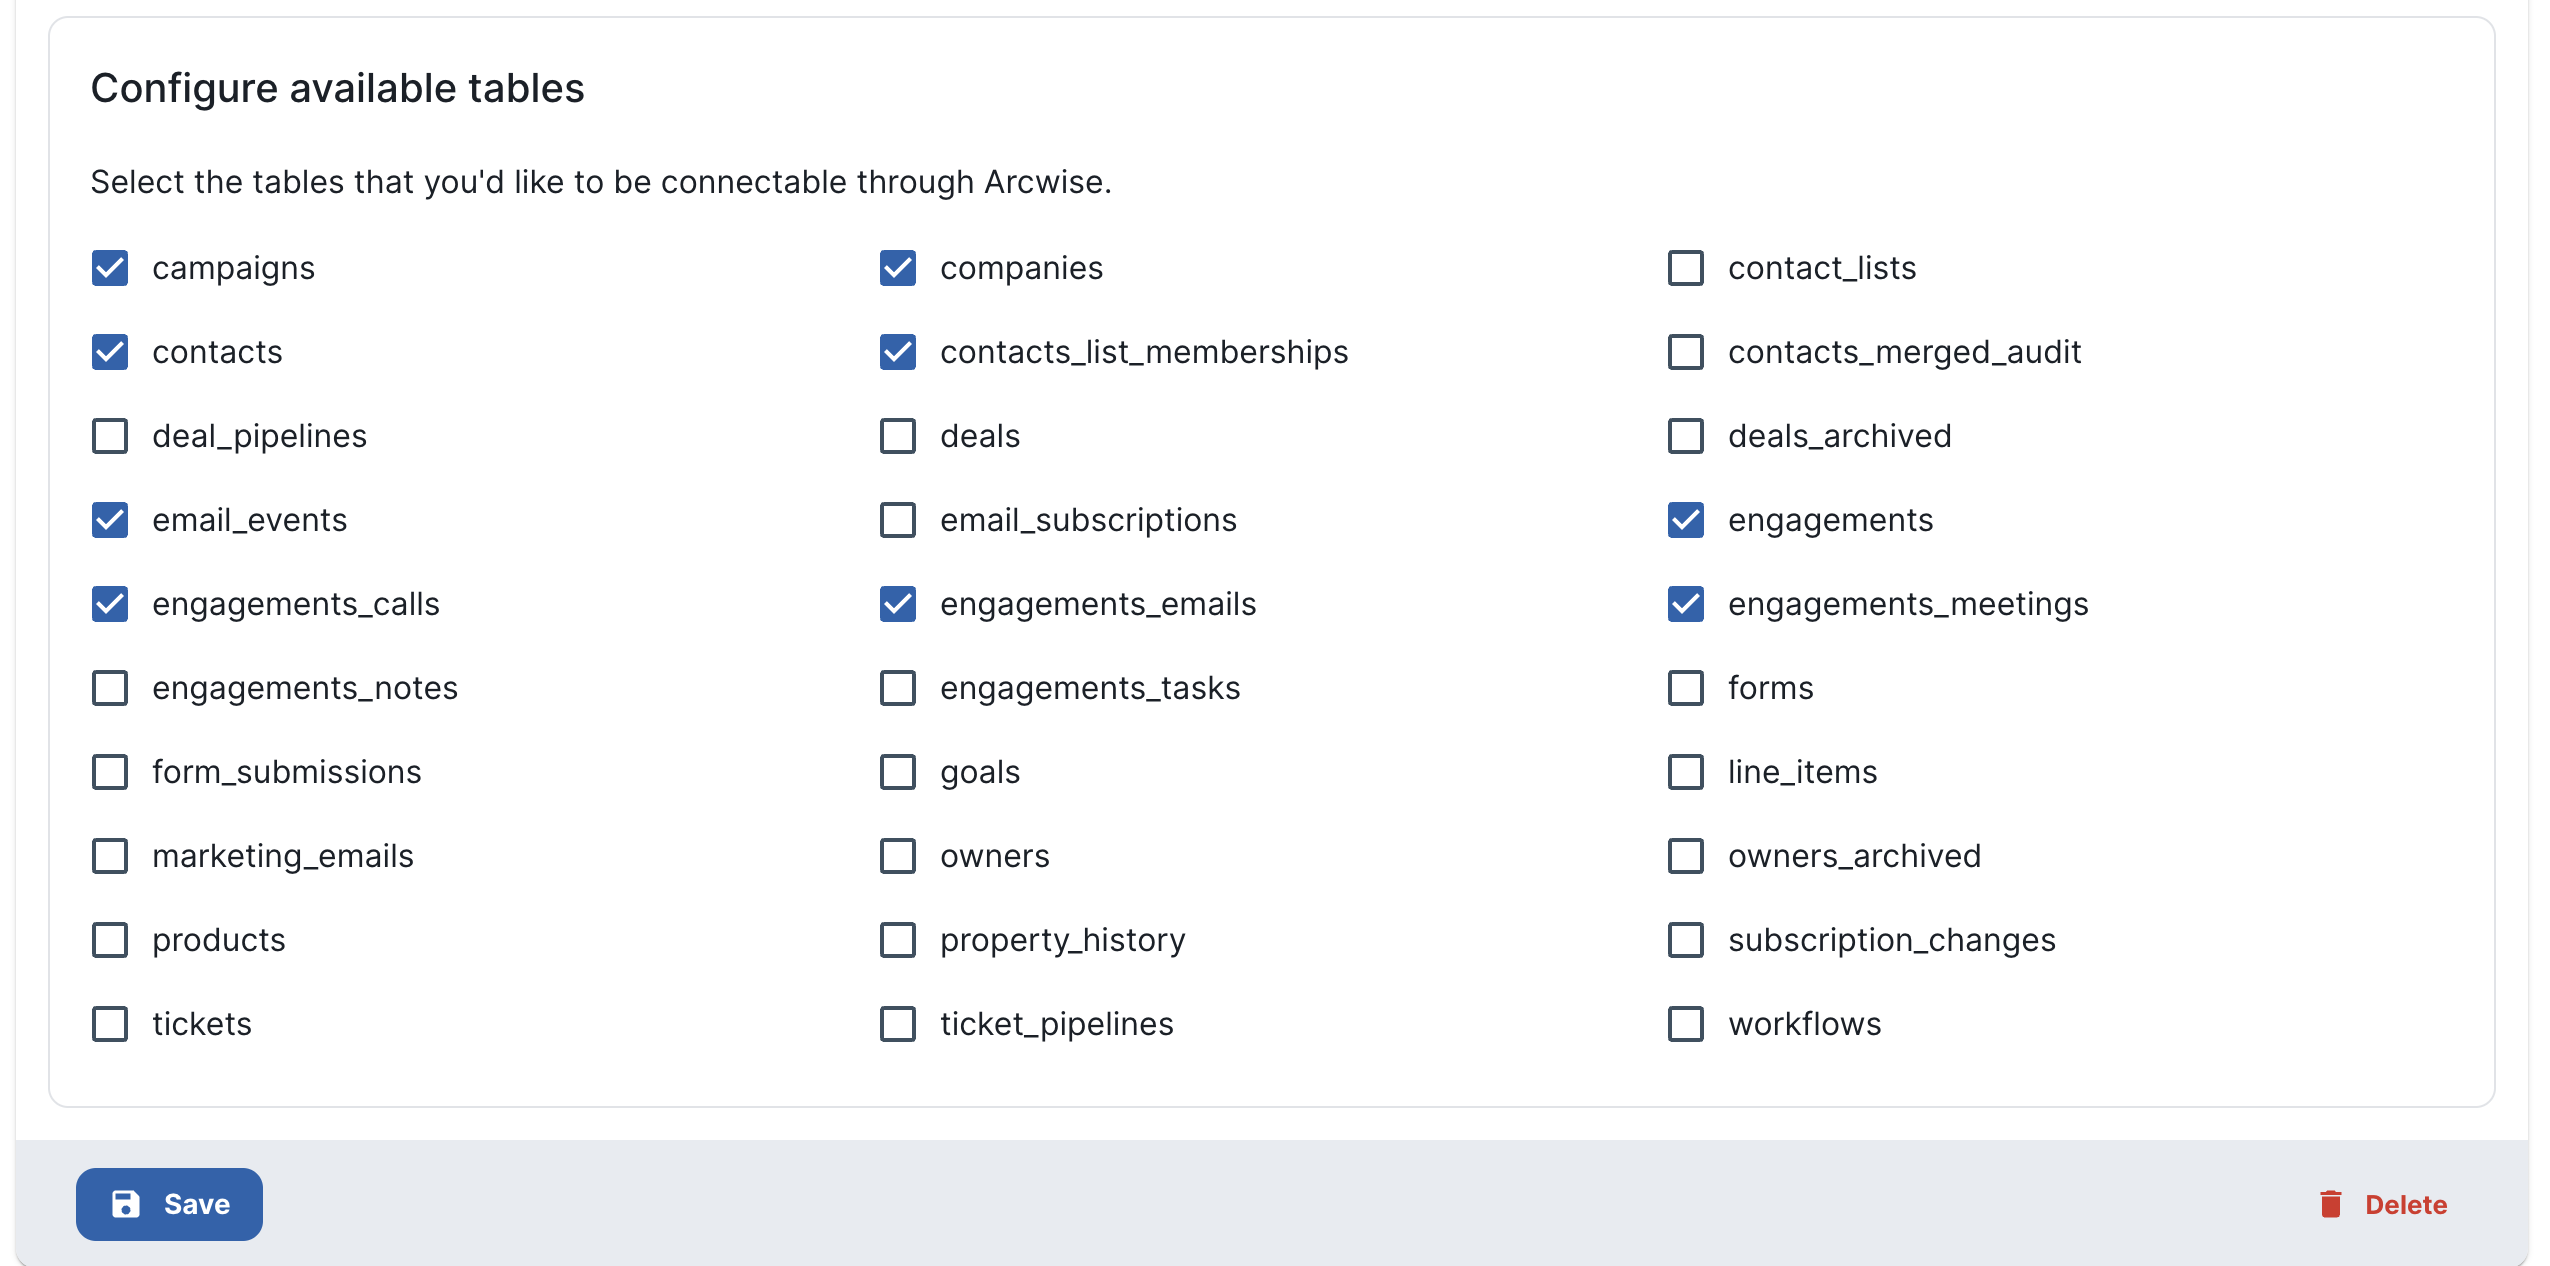
5. Once the list of available tables appears, use the checkboxes to select which Hubspot entities should be available to connect through the Arcwise addon. Scroll down and click "Save" when finished.<br>

   <figure><img src="/files/wDBhh8Yf9lmcMKxBwtvd" alt=""><figcaption></figcaption></figure>


# Salesforce

### Connecting to Salesforce

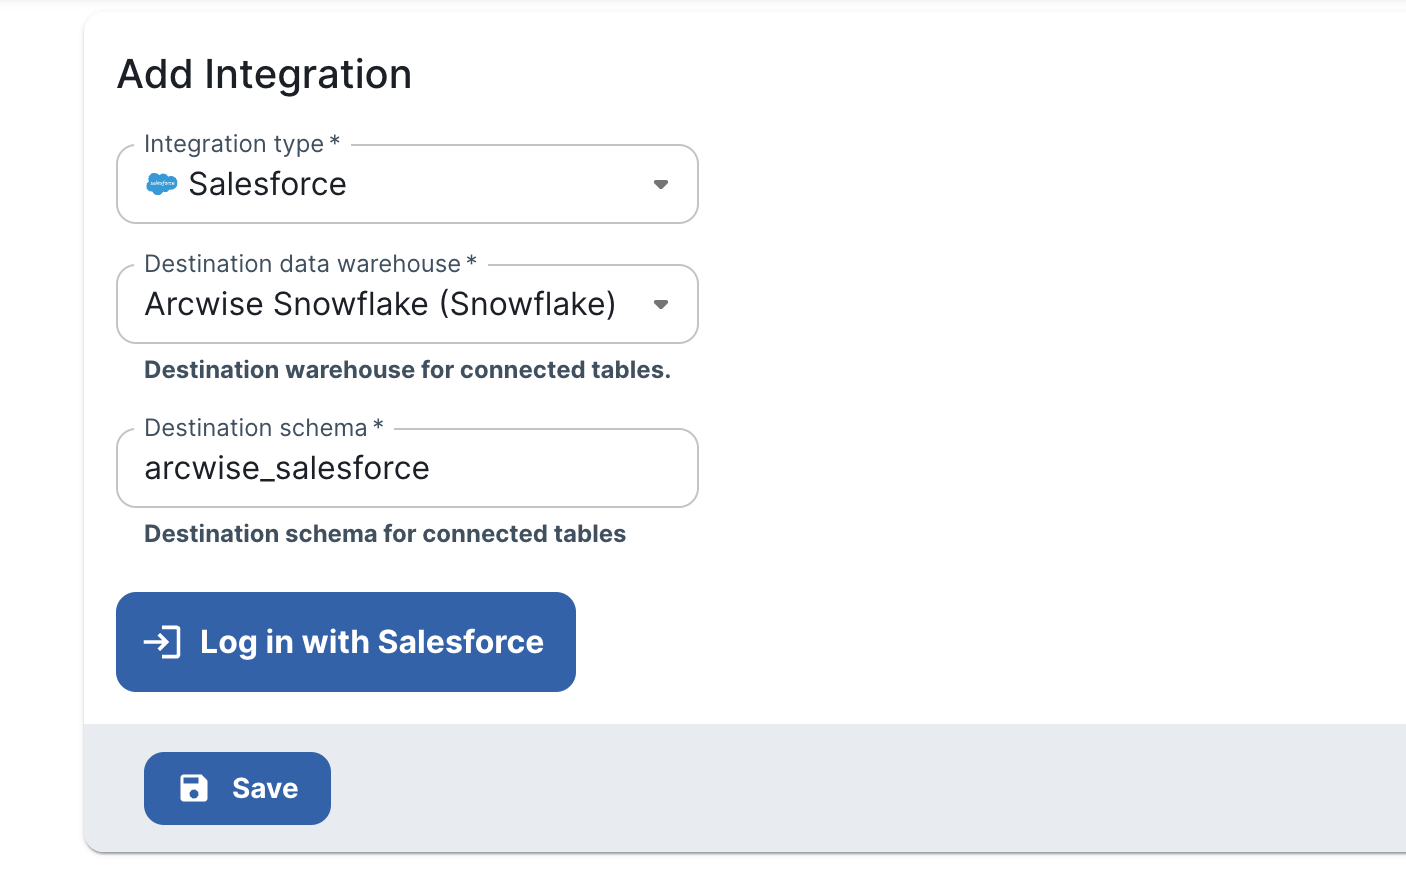
1. Go to <https://admin.arcwise.app/#/api_connections> and click the "+ Create" button.
2. Select "Salesforce" from the dropdown.
3. Select a data warehouse (where Arcwise will store snapshots). See [Overview](/arcwise-setup/integrations/overview) for more information. You can also connect an [S3](/arcwise-setup/connect-data-warehouse/s3) bucket.
   1. For the "Destination schema", the easiest option is to use the snapshot schema linked to the warehouse (e.g. `_arcwise_snapshots`. *Warning: this may be case-sensitive!*). You can also create a new schema if it's preferable.
4. Click the "Log in with Salesforce" button and enter your Salesforce login details. It may take a few minutes to sync the available set of tables.

<figure><img src="/files/Uhc2icwLjwp2WbJm7tGp" alt=""><figcaption></figcaption></figure>

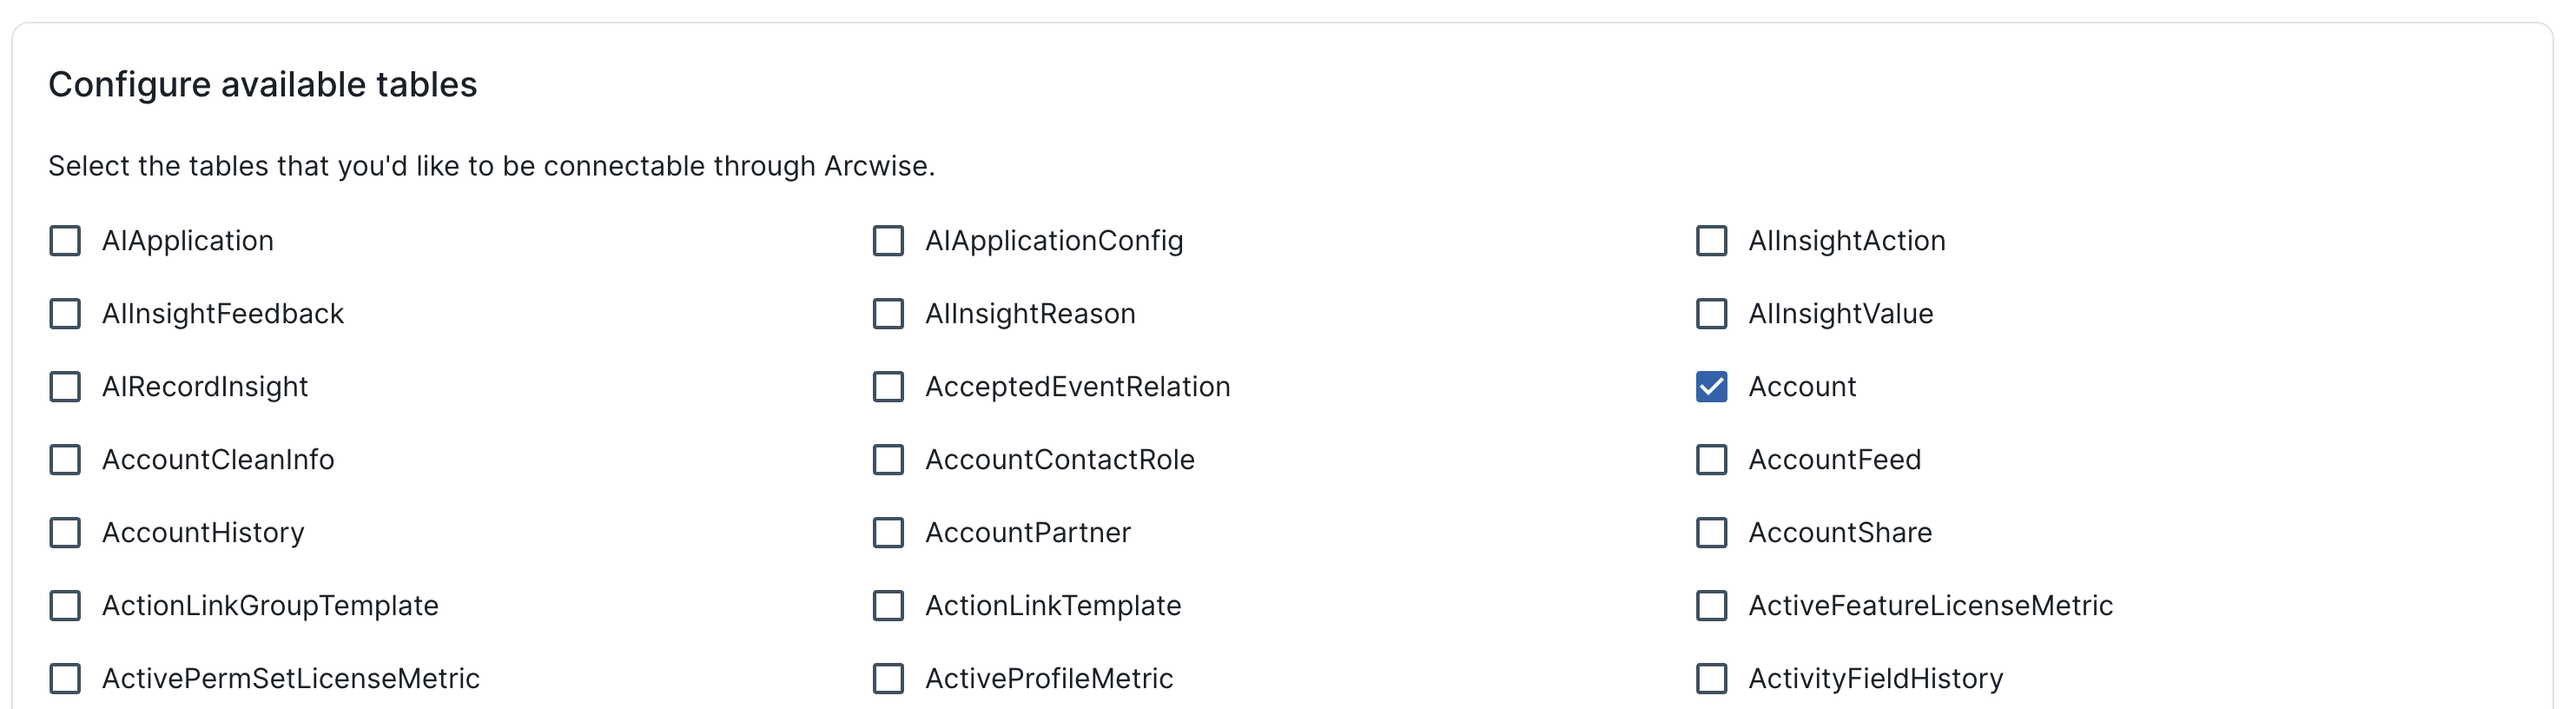
5. Once the list of available tables appears, use the checkboxes to select which Salesforce objects should be available to connect through the Arcwise addon. Scroll down and click "Save" when finished.<br>

   <figure><img src="/files/uG0Hm1HQCFz2xQcEuFOK" alt=""><figcaption><p>You can refer to Salesforce's <a href="https://developer.salesforce.com/docs/atlas.en-us.object_reference.meta/object_reference/sforce_api_objects_list.htm">official documentation about each object</a>.</p></figcaption></figure>

### Connecting to Salesforce objects and reports

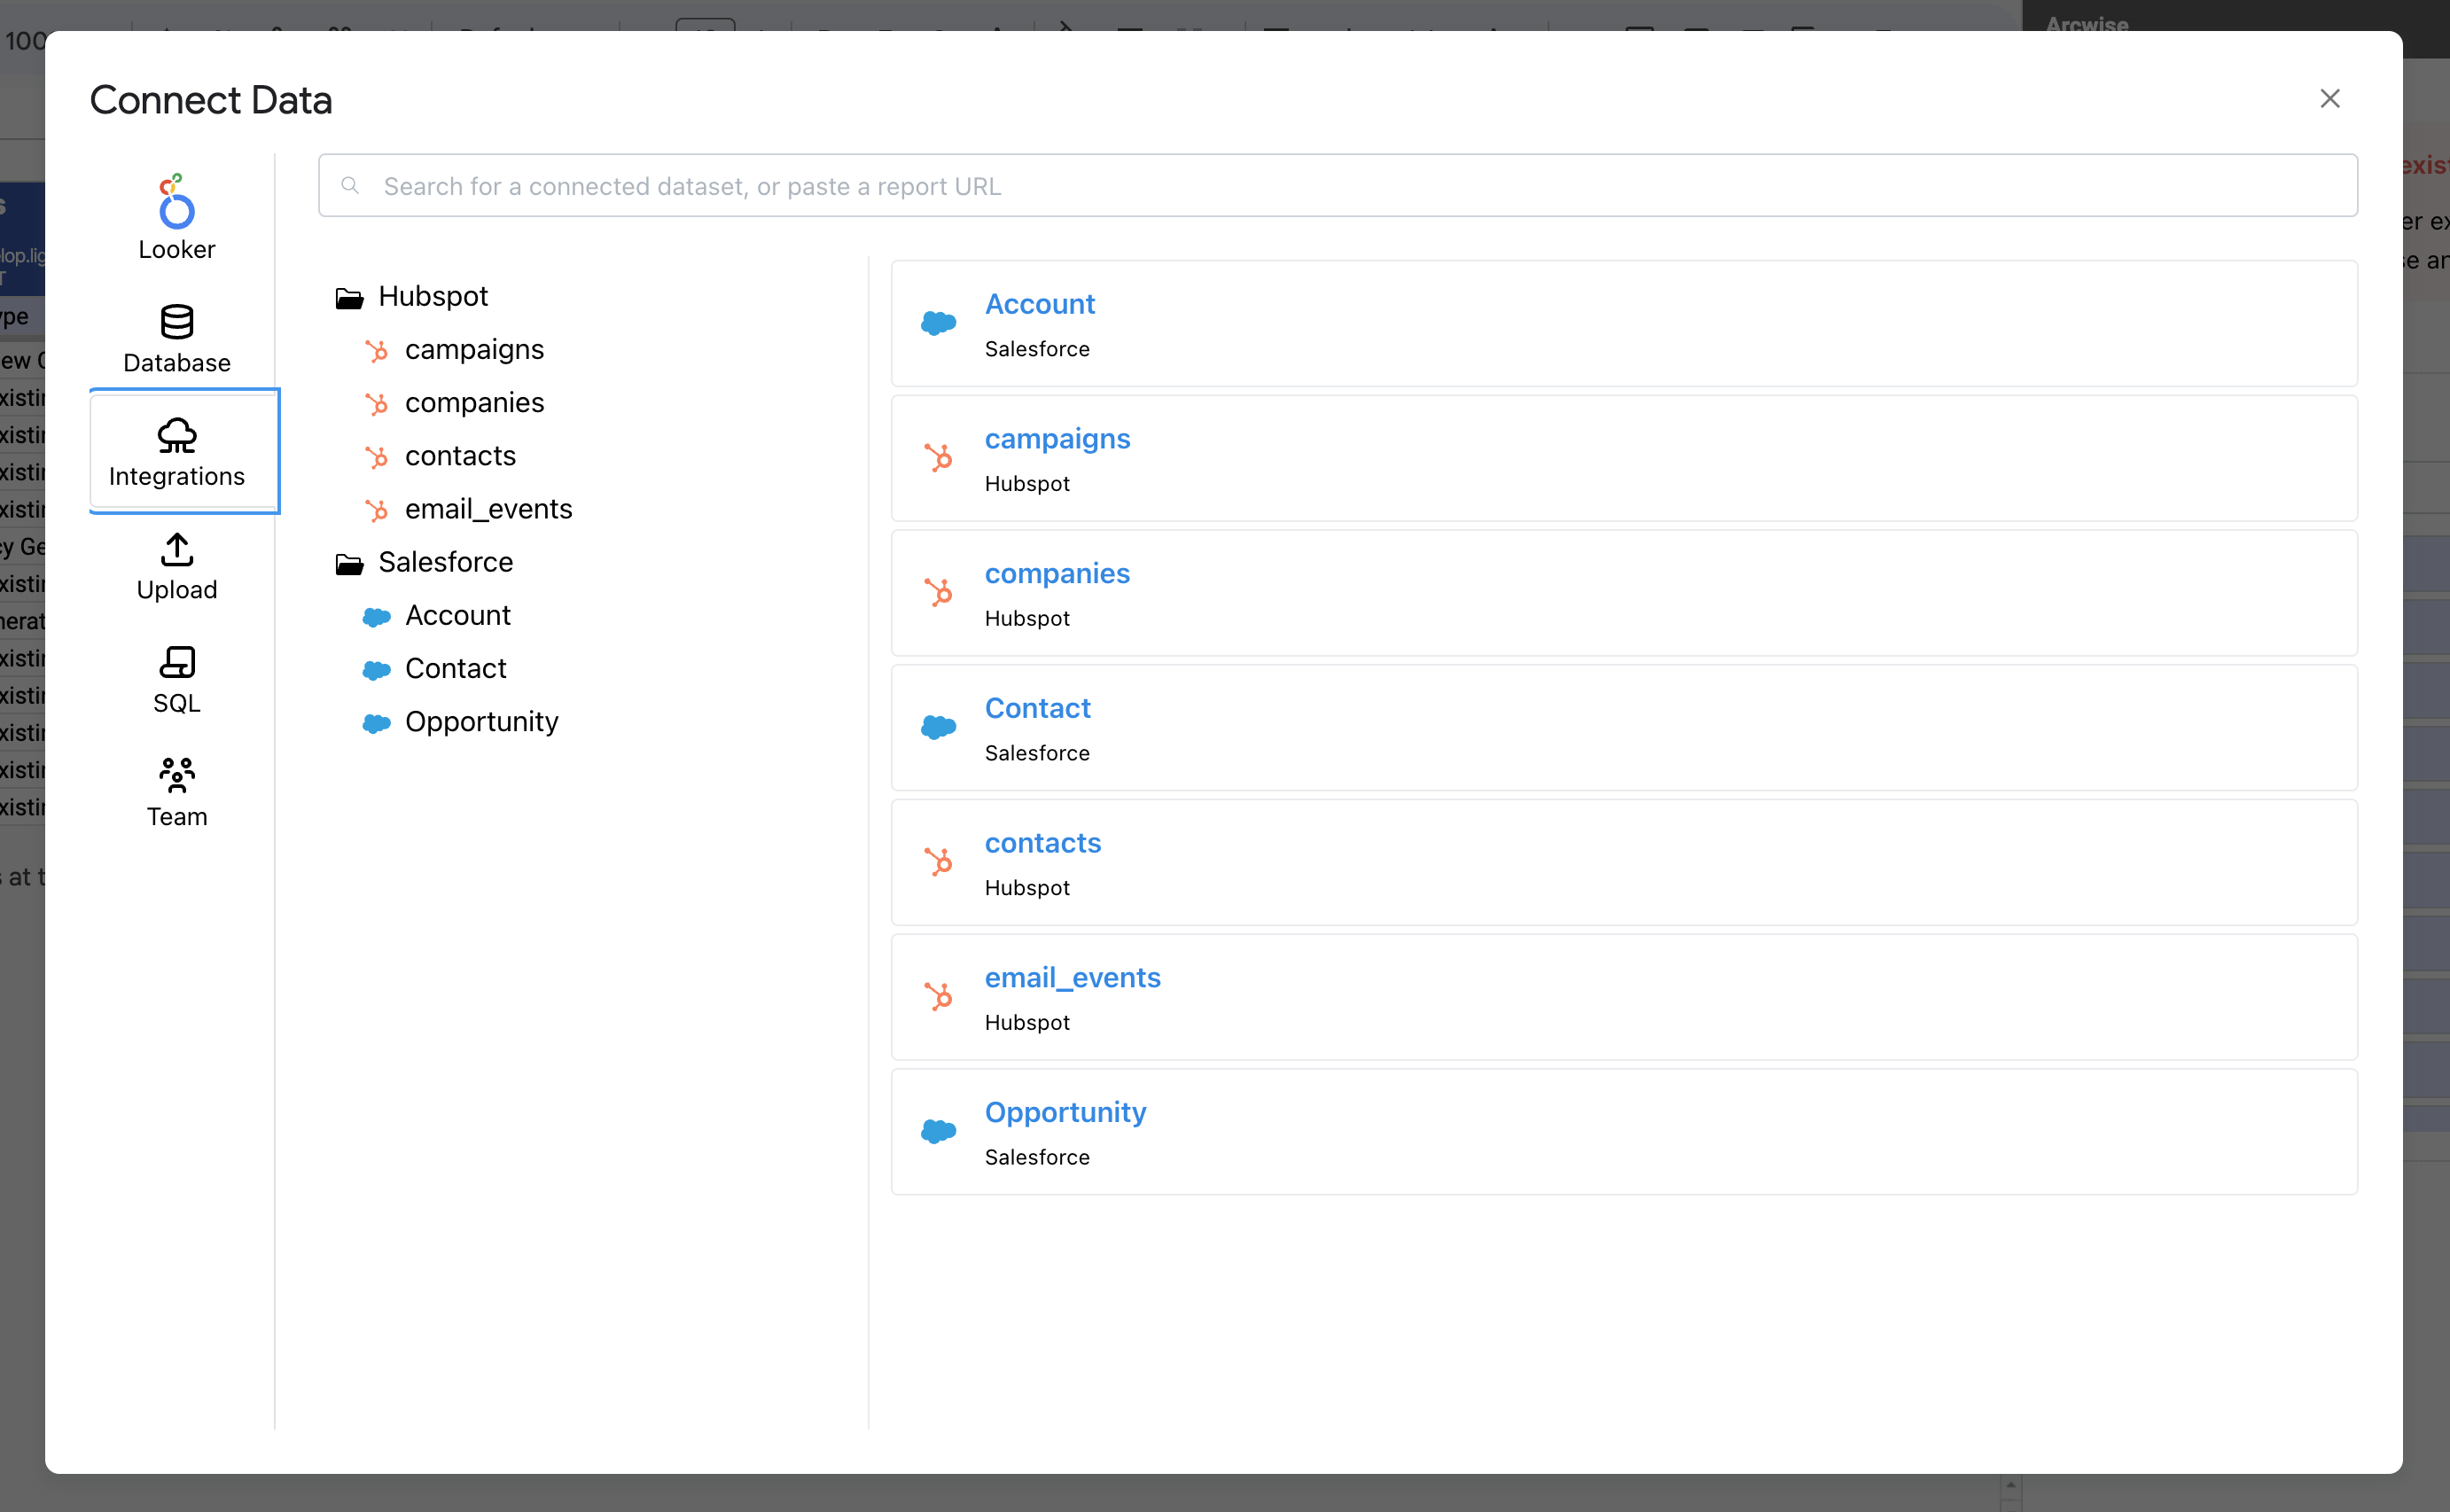
Once connected, you should be able to access the "Integrations" tab from the Connect Data dialog and see the list of tables enabled above:

<figure><img src="/files/Hf93RfWlYJjxIAYfie0i" alt=""><figcaption></figcaption></figure>

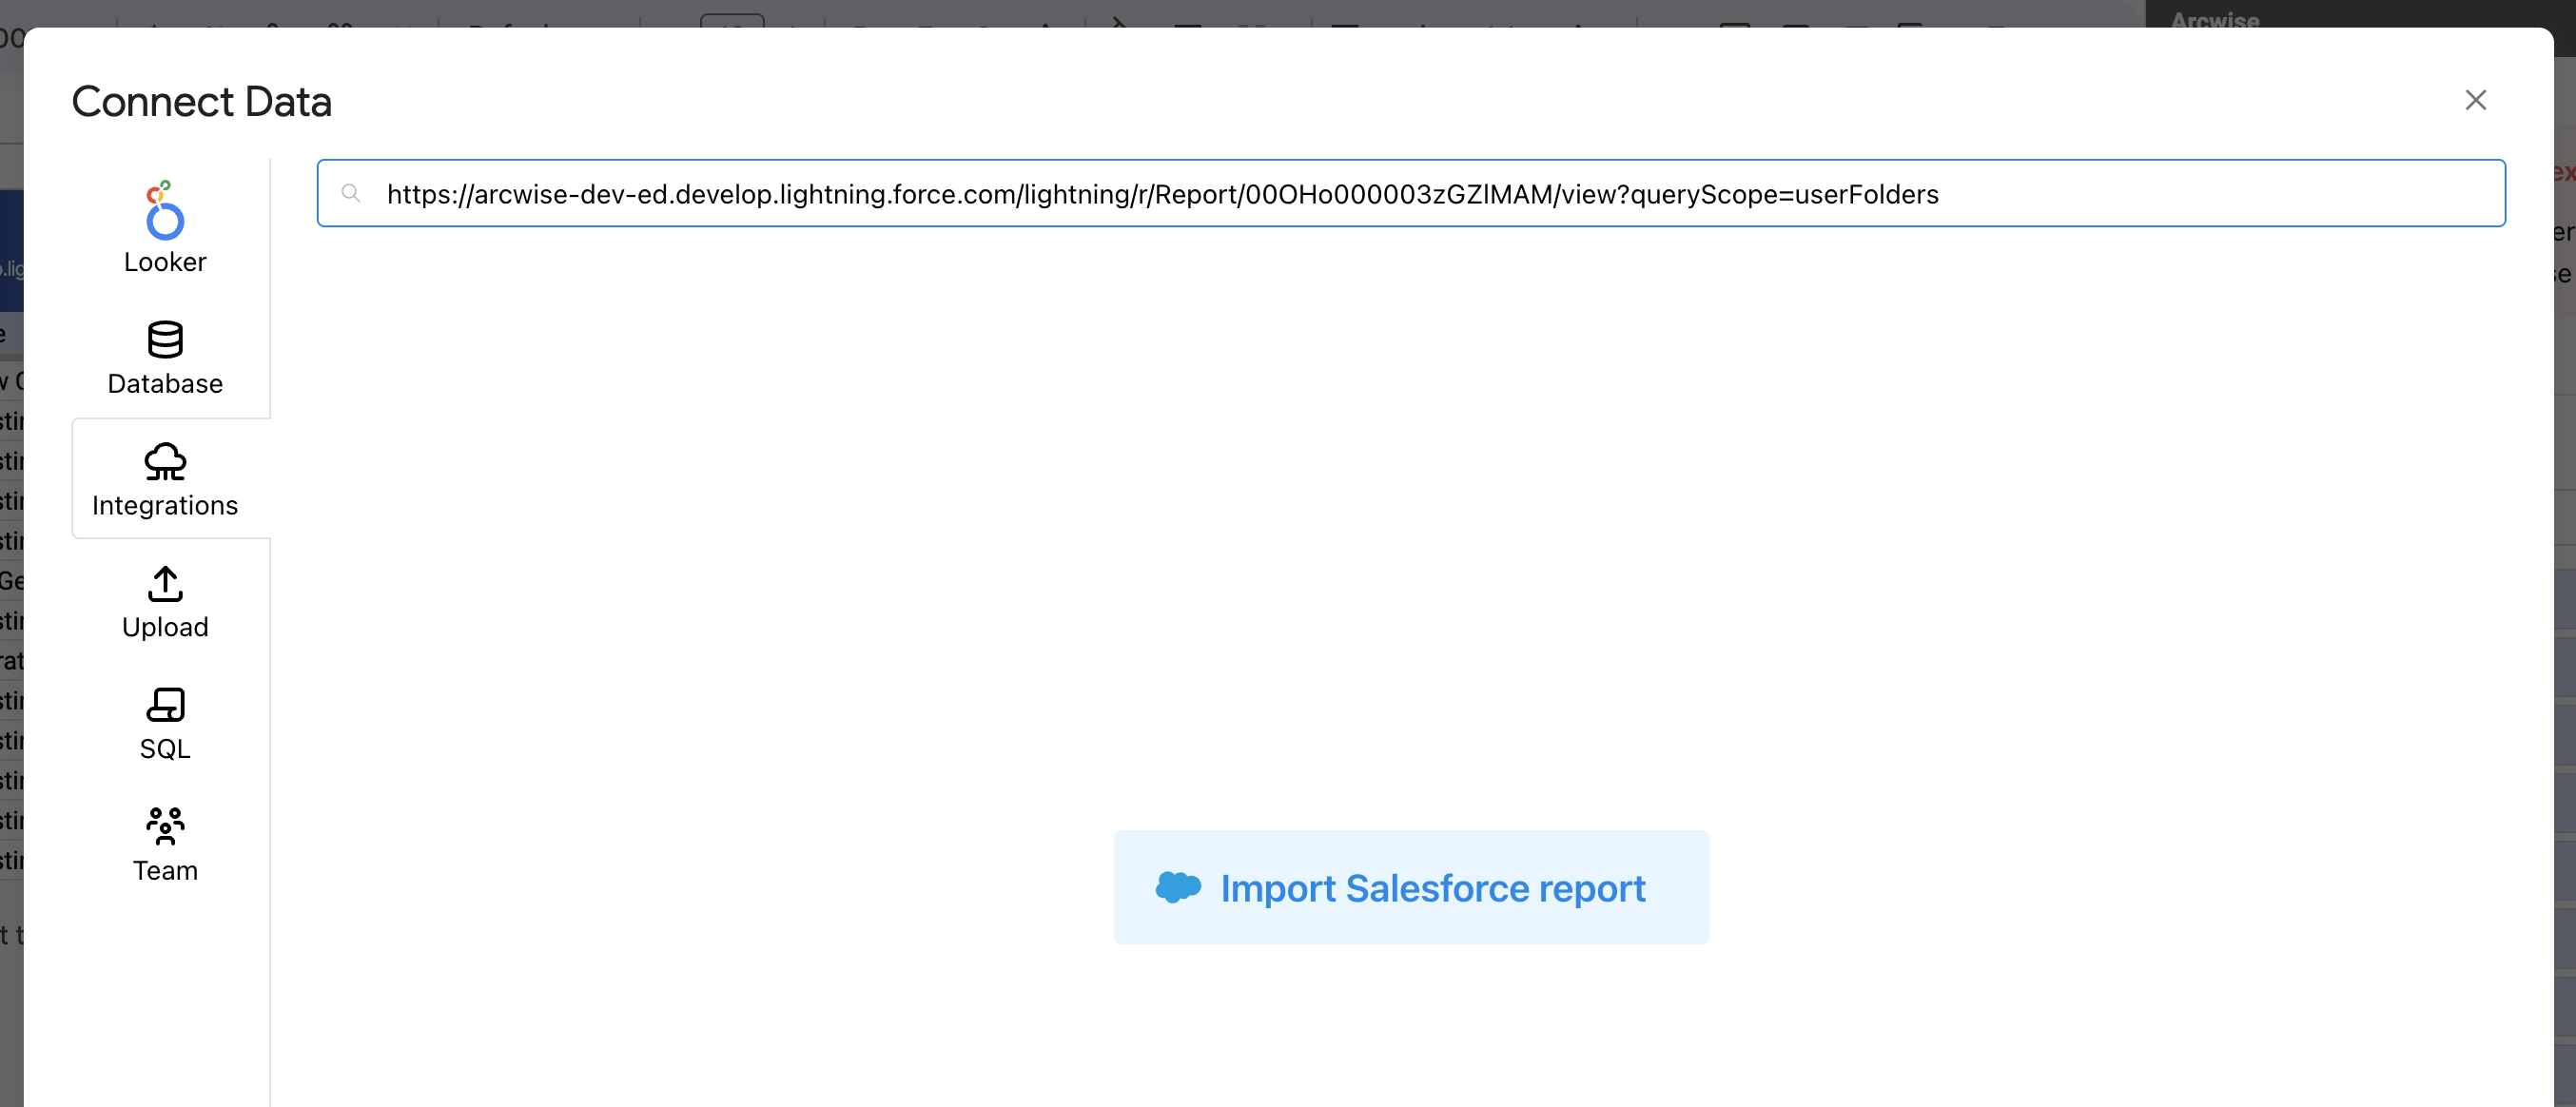
You can also paste a link to a Salesforce report to import it. The report must be in tabular form - avoid using aggregations & groupings (these will not be imported.)

<figure><img src="/files/oov8L0sNWSuGSNNW3ro0" alt=""><figcaption></figcaption></figure>


# FAQ

### **How can I see if permissions were set properly to use Arcwise?**

Using the `ARCWISE` role (or whichever role + user you have set up) run `show tables` in Snowflake. You should see all tables you intended to share access to listed there.

### **I am having trouble granting permissions to Arcwise. What can I do?**

Reach out to us! Common issues include:

* **Snowflake:** Granting access without including grants to `FUTURE`. Often times tables will be dropped and recreated by jobs. When this happens the access is removed unless `FUTURE` is included.

### **How and when does Arcwise use database compute?**

Arcwise uses database compute in two ways:

* When using **Connect Data** Arcwise will execute a `SELECT * XXX LIMIT 1000` query to preview the data.
* When executing an Arc formula, EG `ARCCOUNT`, this is translated to an SQL query that will be executed in your warehouse.

### What does Arcwise do with access to DBT?

Arcwise does the following:

* read dbt artifacts
* read results of last dbt job
* read semantic later proxy URL (if you have it set up)

Arcwise *doesn't* run any jobs. It is sufficient to grant Arcwise `Job Viewer` permissions.

### **What does Arcwise do with access to Snowflake database data?**

Arcwise uses this access to read query history (SQL only, not data). This query history is used to present the most relevant tables, columns, and joins to Arcwise users.

### **What data is stored by Arcwise?**

For basic usage of the tool we store:

* names of tables
* names of columns

If we are granted access to Snowflake database data we additionally store query history (SQL only, not data), usage counts of tables, usage counts of columns, and usage counts of joins.

### How does Arcwise store sensitive data securely?

We use authenticated encryption to protect sensitive data, ensuring both confidentiality and integrity. Each organization has a unique encryption key. The key is securely generated using an industry-standard algorithm and is 256 bits in length, providing strong protection against unauthorized access.

This approach is used for both organization level credentials (like API keys) and data warehouse connection credentials (like keyfiles and passwords).

### Why does the app request Google permissions?

Our app requests the following Google OAuth scopes to perform specific actions on the user behalf and to ensure a seamless user experience:

* **`https://www.googleapis.com/auth/bigquery`** - Allows the app to execute BigQuery queries on user behalf.
* **`https://www.googleapis.com/auth/drive.file`** - Lets the app create and edit only the files it has opened or created in your Google Drive.
* **`https://www.googleapis.com/auth/spreadsheets`** - Enables editing of Google Sheets documents on user behalf.
* **`https://www.googleapis.com/auth/presentations`** - Enables editing of Google Slides presentations on user behalf.
* **`email`**, **`profile`**, **`openid`** - These are used for login (when SSO is not used) and to retrieve basic user information like name and email address.

We only request the minimum necessary permissions to support features like querying data, updating documents, and authenticating your identity.


# Google Login Errors

Resolving common Google login issues

## "\[400] Sheets permissions required"

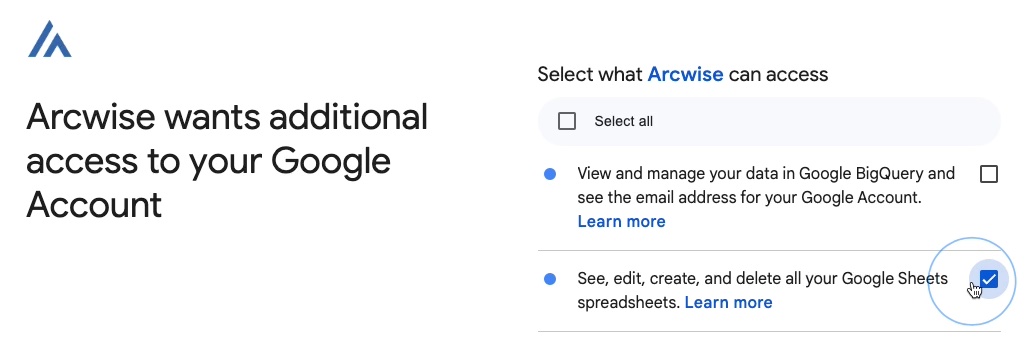
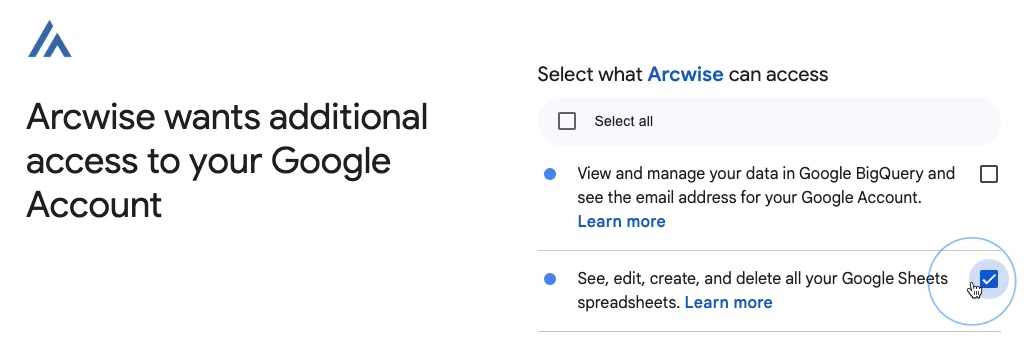
When logging in, ensure that you authorize Arcwise to access your Google Sheets (and if your organization requires it, BigQuery).

*Note: Unfortunately, Google doesn't allow us to ask for more granular permissions. Rest assured that we won't read or modify any sheets you haven't explicitly used Arcwise in.*

<figure><img src="/files/rXqPMdQLDkY29rbjVh1W" alt=""><figcaption></figcaption></figure>

## “400 Bad Request” errors

To resolve this error, you’ll have to clear the site cookies for [accounts.google.com](http://accounts.google.com). Follow the steps in this video:

{% embed url="<https://www.loom.com/share/3e3ac5a3d2ba4acda531961be8cab218>" %}

**Step-by-step**

1. Click the settings icon (either a “knobs/filters” 🎛️ or “lock” 🔒 icon) on the left-hand side of the address bar while the current page is on the [accounts.google.com](http://accounts.google.com) login page.
2. Click “Cookies and site data”.
3. Click “Manage cookies and site data”.
4. Click the “trash can” / delete icon next to [accounts.google.com](http://accounts.google.com).
5. Reload the page. The login form should now work correctly - enter your email to continue.

If that still doesn’t work, you can also try opening this page in a new Chrome tab: `chrome://settings/content/siteDetails?site=https%3A%2F%2Faccounts.google.com` and clicking the “Clear data” button.

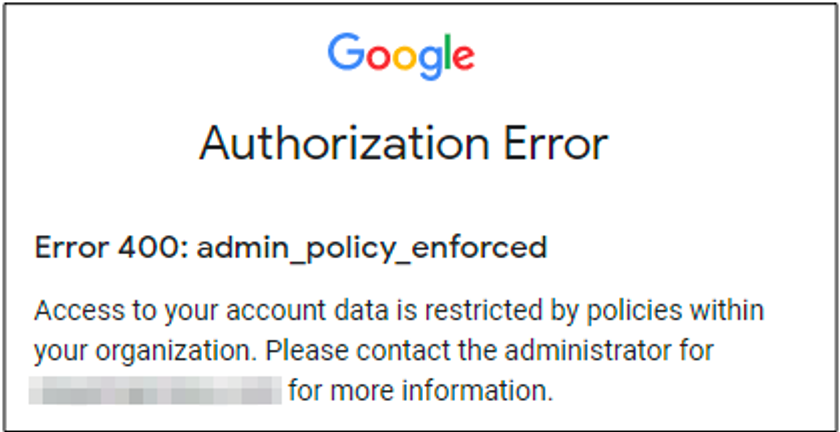
## Error 400: admin\_policy\_enforced

*(For enterprise Google Workspace accounts)*

<figure><img src="/files/4qasaR9VVLx1QkHtiEmL" alt="" width="375"><figcaption></figcaption></figure>

Unfortunately, if you encounter this error, you may not be able to use Arcwise unless it’s been approved by an administrator in your organization. (Reach out at [contact@arcwise.app](https://www.notion.so/Resolving-Arcwise-login-issues-cc6c90a4e8ae4cf5b0c41068e999744f?pvs=21) to speak with the team!)


# Product Changelog

Updates to the Arcwise product

#### 2023/12/13

* **AI Analyst**
  * Added advanced AI Analyst settings to control which tables the AI can see, as well as customization of the system prompt. Go into the [Arcwise Admin panel](https://admin.arcwise.app/#/warehouse_connections) (under "Connections") and open the "Advanced Settings" section in your warehouse connection.
  * Visualization capabilities are now more consistent, especially with multi-line plots.
  * Fix a minor overflow issue with AI Analyst result tables.
* Improved preview tables across the product (you can now select and copy+paste from the grid like a spreadsheet)
* Numeric input filters now display a list of sample values from the database.
* \[New] Formula hints: the Arcwise Chrome extension can now display tooltips with the column names and types for all Arcwise columns used in a formula.
  * [Hover over the Arcwise icon in the formula bar and click “Enable formula hints”](https://cleanshot.arcwi.se/cpH5SWMJDzRbX9kt4Tmt) to get started.
* Fixes to BigQuery SQL generation
* \[Beta] Added “Import data tabs” feature to the custom SQL editor. This allows you to reference other Arcwise-connected sheets by name in the SQL query (e.g. `SELECT * FROM Sheet1`)

#### 2023/12/11

* Improved column formula copilot suggestions
* Added additional entrypoints for the AI Analyst (Arcwise menu > "AI Analyst", new action for empty tabs)
* Lots of small bugfixes

#### 2023/11/28

* \[Beta] Support for Stripe and Google Analytics connectors. Configure them in the ["Integrations" section of the admin panel](https://admin.arcwise.app/#/api_connections).
* Internal bugfixes and improvements.

#### 2023/11/21

* Added a new flowchart UI where you can visualize the flow of data between Arcwise tabs in your sheet (go to Extensions > Arcwise > Open Flow)
  * [Screenshot](https://cleanshot.arcwi.se/vzSVxnrSt9KnhYPmDWTZ)
* You can now “drill down” into any Arcwise SQL formula to inspect the underlying rows and SQL that match your function’s criteria. Click the Arcwise icon in the formula bar (currently only works for “big data” formulas).
  * [Video demo](https://cleanshot.arcwi.se/ZPxBspD8XsBNWblTSwbJ)
    * (You may need to update your Arcwise Chrome extension to the latest version)
* We’ve added a “[Spreadsheets](https://admin.arcwise.app/#/spreadsheet_entity)” view to the admin panel, which lets you see all your org’s spreadsheets at a glance. Click into any spreadsheet to examine its connections.
  * The “[Tables](https://admin.arcwise.app/#/warehouse_entities)” view also shows the number of connected sheets per table. Click into any table to see all of its linked spreadsheets.
* Fixed a bug where the formula field’s autocompletion wasn’t working correctly.

#### 2023/11/09

* \[Beta] Experimental support for [connecting to Salesforce & Hubspot entities](/arcwise-setup/integrations/overview).&#x20;
* Added support for SUMBY & MINBY column functions, which allow you to calculate the sum & min of groups of rows.
* Improved performance of large pivot table previews.

#### 2023/11/03

* Fixed an error where long-running data tab updates may time out. We also [added a progress indicator](https://cleanshot.arcwi.se/DbVQvR3zv28slnKDmL1h) for better visibility into what’s going on (which downstream pivots are being refreshed, etc.)
  * Downstream Arcwise formulas will now be automatically refreshed as well.
* AI Analyst: added chat histories. Chat threads are now persistent and you can revisit past threads across sessions.
  * All chat history is stored locally in your browser - we don’t store any of your data on our backend.
  * Also added the ability to ‘pop out’ the AI analyst into a popup window.
  * Access these new features [from the dropdown menu at the top-right](https://cleanshot.arcwi.se/bw4YMWzWYWHVCPjQPq18).
* When filtering on columns with thousands of distinct values, the selection dropdown will now dynamically re-fetch its populated values to match the current input.

#### 2023/10/23

* Pivot filters now dynamically fetch updated values based on your current input.
* Fix FIND() in Postgres formula fields.

#### 2023/10/19

* Fixed XLOOKUP for Postgres databases.
* AI analyst - fixed errors when conversation gets too long & improved responses for visualization requests.
* One-click “Edit SQL” in the sidebar SQL panel. [Video demo](https://www.loom.com/share/3d7a1978fa5b478ca23182568fcf3be9)
  * Note: The user will be shown a modal that explains that by doing this, they’ll convert their existing connection to a custom SQL connection.
* Automatically sets the sheet title to match the connected data name if the sheet title is a default Google Sheets title (e.g. “Sheet1”, “Sheet2”, etc).

#### 2023/10/13

* You can now preview changes to connected data tabs before saving (click the “Preview” button next to “Update Query”).
* Note: adding or editing formula fields no longer automatically saves until you press “Update Query”. [Video demo](https://cln.sh/9HsXctwSCvk7GxTcVkrK)
* \[Beta] Use the new “Team” tab in the Connect Data dialog to see your team’s Arcwise-connected spreadsheets at a glance, including all the datasets each spreadsheet is connected to.
* Simplified the SQL that Arcwise generates for most data connections (avoiding unnecessary use of CTEs)

#### 2023/10/05

* **Connect Data**
  * We’ve redesigned the Connect Data flow with all-new search results page & preview pages!
  * New: you’re also able to see the number of Arcwise sheets connected to any given table, as well as when it was last connected. By default, search results are now ranked by the number of Arcwise connections.
  * [Video walkthrough of the new connect flow](https://cln.sh/kHpdWY0Yn3XTFFN18q8Q)
* Simplified the generated SQL for most connection types.
* Fixed a bug where pivot tabs sometimes indicated spurious unsaved changes.

#### 2023/09/28

* Always write Looker looks to the Sheet as "plain table" pivots.
* When previewing data, add clearer messaging when only a preview of the dataset will fit in the spreadsheet. [Screenshot](https://cln.sh/sN382JBs9tgFZlnd0GFD)
* Add `DATEVALUE` column function to convert strings to dates.

#### 2023/09/25

* (Beta) Added support for XLOOKUP in formula fields. Use the XLOOKUP function with any search column along with a “lookup column” and a “result column” from another Arcwise table.
  * [Video demo](https://www.loom.com/share/e8274488c2d34febb7d9e3476b7fa83c)
* When writing a formula field, column names matching your current input [will now be auto-suggested alongside the function suggestions](https://cln.sh/BfhJ2Vr8MgDGFJnw3rMC).
* If you have unsaved changes to an Arcwise data or pivot sheet and switch to another sheet tab, you’ll now see [a blue banner at the top prompting you](https://cln.sh/QlH2nMKsMSVdZy7cpNJ2) to save your changes (rather than instantly discarding the unsaved changes).
* [Added a settings section to pivot tabs](https://cln.sh/dFJb21xG1ZVbBQfDgFhp), where you can adjust whether the pivot has totals, is saved as a plain table, or is auto-updated when the source data refreshes.

#### 2023/09/22

* Pivot tabs now automatically refresh when the source data tab is refreshed or updated.
* \[Beta] Added a new option in the Arcwise menu to refresh all Arcwise data and formulas in the current spreadsheet.&#x20;
  * [Video demo: All connected sheets](https://www.loom.com/share/a4952307c92747609f496fe5a365cedc), [Video demo: Single connected sheet](https://www.loom.com/share/7968f0f8b44c4a7cb410fbbcce7d95aa)
  * Find it under [Extensions > Arcwise > Refresh all connected Arcwise data and formulas](https://cln.sh/Bty7wh8NVHPPth42B9Pj).

#### 2023/09/18

* Added a row count to the “connect data” preview window (works when connecting both regular tables and SQL queries).
  * Screenshots: [when connecting table](https://cln.sh/Lk06ZxN1Shw9gLcwbDwx), when [previewing a SQL query](https://cln.sh/fgxfM03zw2znsJ5rQV94)
* **Pivot tables**
  * You can now order pivots by values - right-click an aggregation and sort by ascending or descending
  * You can now easily aggregate by year/quarter/month/week/day for date fields
  * You can now apply a limit to pivot results - toggle the “Limit results” selector in the bottom left
    * (Works in conjunction with ordering if you want e.g. the top 10 years by the sum of sales).
  * [Video demonstration of all the features above](https://www.loom.com/share/3f649b9ea67d4f28b7eda8d4e9eac019)
* **SQL editor**
  * Added autocompletion for table names, column names, and keywords
  * You can now click on tables in the left-side tree view to see their columns as well as a preview of table contents.
  * [Video demonstration of new SQL editor](https://www.loom.com/share/2e5699f16d9b4bf7b4f9fc9837ff08e2)

#### 2023/09/12

* Fix issue where custom SQL query connections were often not respecting the sheet cell limit.

#### 2023/09/09

* Looker integration - import Looks by URL
* “Connect SQL” has moved inside the “Connect Data” dialog.
  * Redesigned the “Connect Data” flow to have horizontal tabs for tables, file uploads, and SQL queries (along with a few other very minor changes.)
  * Allow for a Custom SQL query tab to be changed to an entity connect tab and vice-versa.
* Formula field & pivot value formula editors now auto-suggest column names
* Added support for additional column formula functions: AND/OR/NOT/INT/VALUE
* **Pivot tables**
  * The fields section of the Pivot Table modal is now resizable
  * You can now right-click pivot table fields to remove them


# Connecting Data

Arcwise allows users to work with several different data sources. Below you will find the details on how to import each type of data source into your spreadsheet using Arcwise.

{% content-ref url="/pages/HSMb3Ojt6kD9SA0u4som" %}
[Data Warehouse](/connecting-data/data-warehouse)
{% endcontent-ref %}

{% content-ref url="/pages/hYY1EDQEOo4O7kmSibsr" %}
[Uploading CSV Files](/connecting-data/uploading-csv-files)
{% endcontent-ref %}

{% content-ref url="/pages/VSzBhe3k3Fkb4E9trpII" %}
[Importing Data from Other Tools](/connecting-data/importing-data-from-other-tools)
{% endcontent-ref %}

{% hint style="success" %}
Arcwise can work with data of any size. Millions or even billions of rows can be worked on. Do not hesitate to connect data that is very large! See [Working With Large Data](/using-arcwise-in-sheets/working-with-large-data) for more details.
{% endhint %}


# Data Warehouse

There are three alternative ways to connect data from your data warehouse:&#x20;

* **AI:** This is the preferred option and is often the simplest. Use this option when you would like the AI to assist in finding the correct data or doing light transformations of the data prior to working with it in your spreadsheet. See [Getting Data Using AI](/using-arcwise-ai-analyst/getting-data-using-ai) for using this option.
* **Data Catalog:** Use this option if you want to quickly connect a known table.
* **Connect Data:** Use this option to manually explore and search for tables.

{% hint style="info" %}
If your data is large the data in the sheet will be truncated to 100 rows. You can still work with this data, however! See [Working With Large Data](/using-arcwise-in-sheets/working-with-large-data).
{% endhint %}

{% tabs %}
{% tab title="Data Catalog" %}
1\) Navigate to the Arcwise icon at the top right corner of your sheet and click it.

<div data-full-width="false"><figure><img src="/files/vJPKMaDbBN9AqoCWEH6h" alt="" width="363"><figcaption><p>The Arcwise icon appears at the top right of your Google Sheet</p></figcaption></figure></div>

2\) From the command palette select **View all connect data** near the bottom.

<figure><img src="/files/f8XAPvNhoT47IOv0890m" alt="" width="375"><figcaption></figcaption></figure>

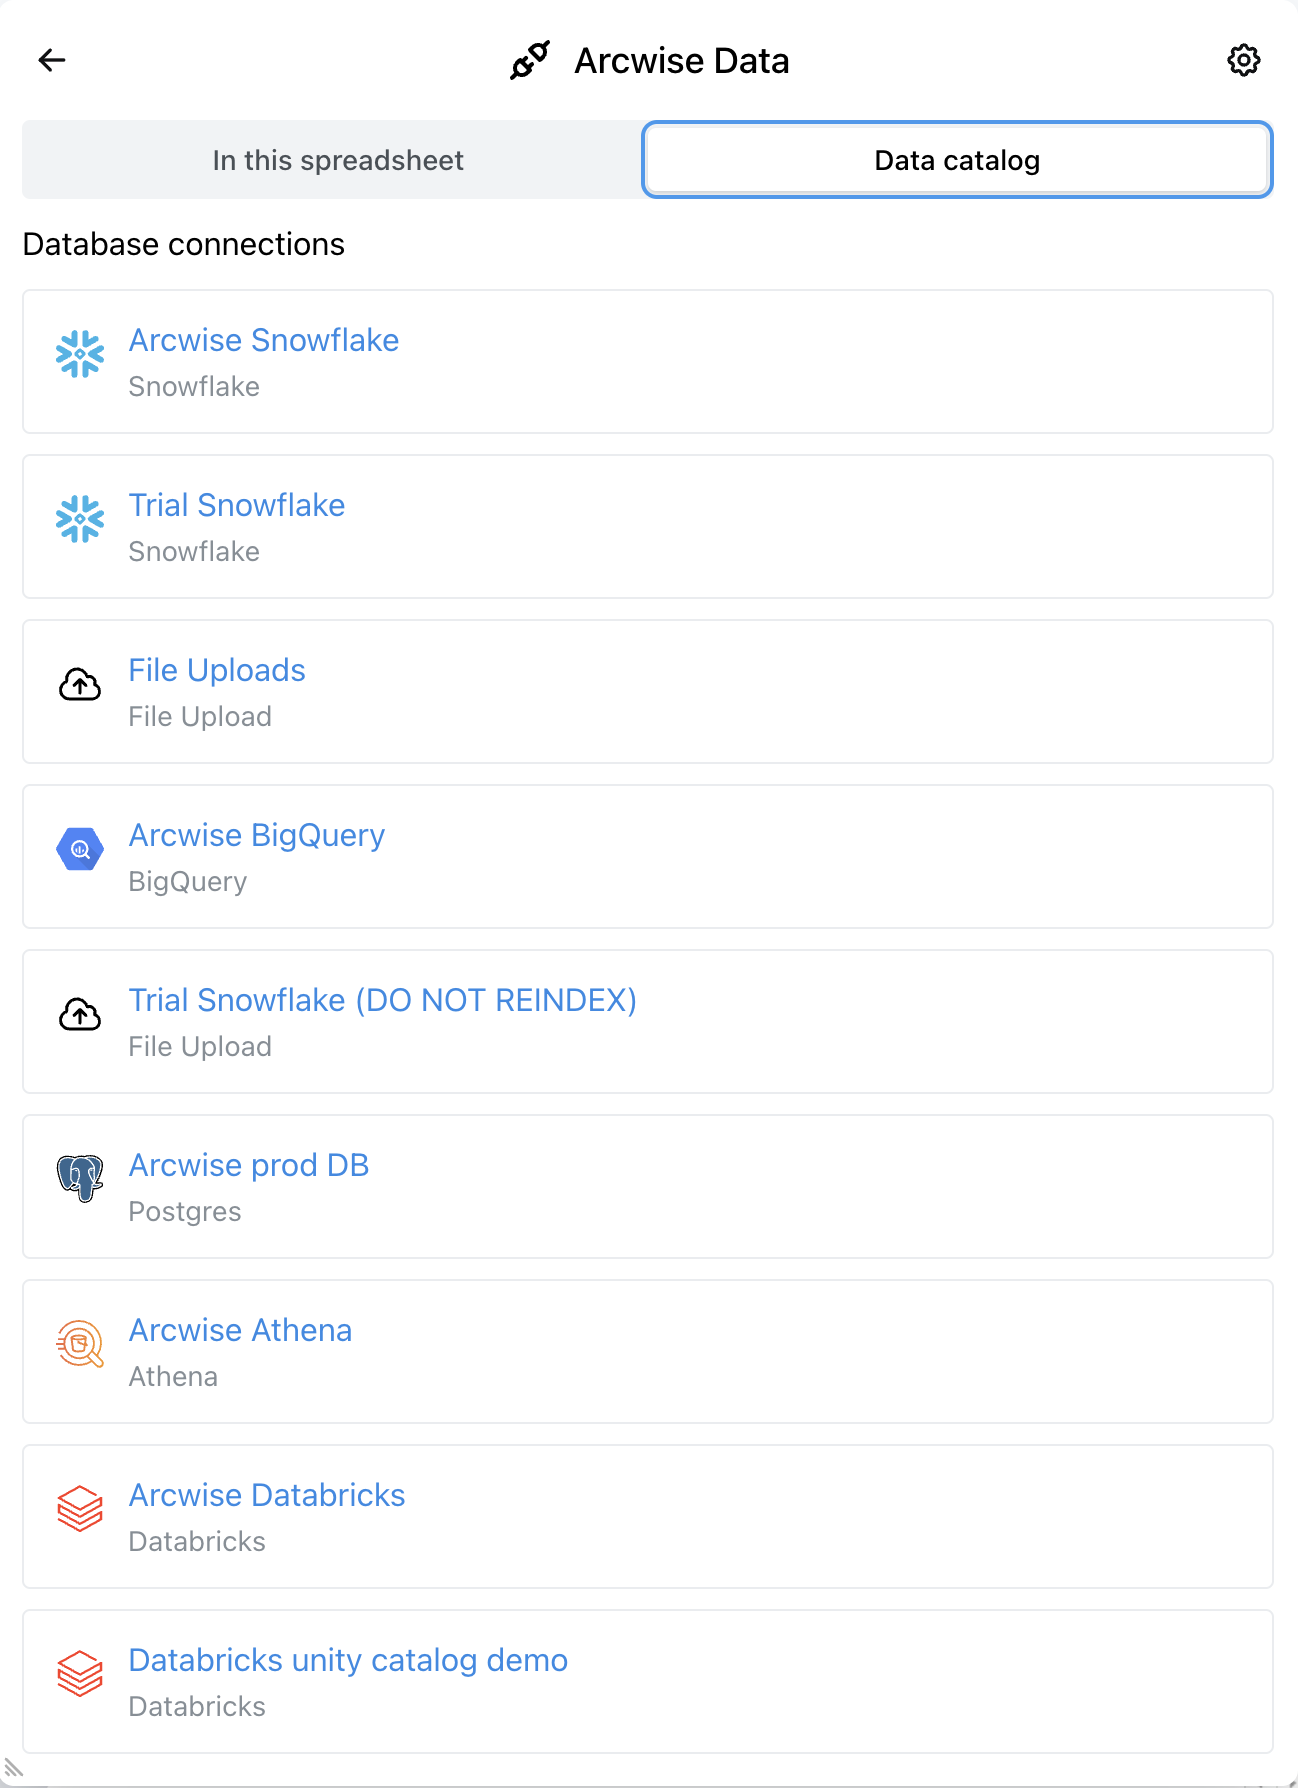
3\) Select the **Data catalog** tab.

<figure><img src="/files/vTAVXS4QGCrYrRNJNW7T" alt="" width="375"><figcaption></figcaption></figure>

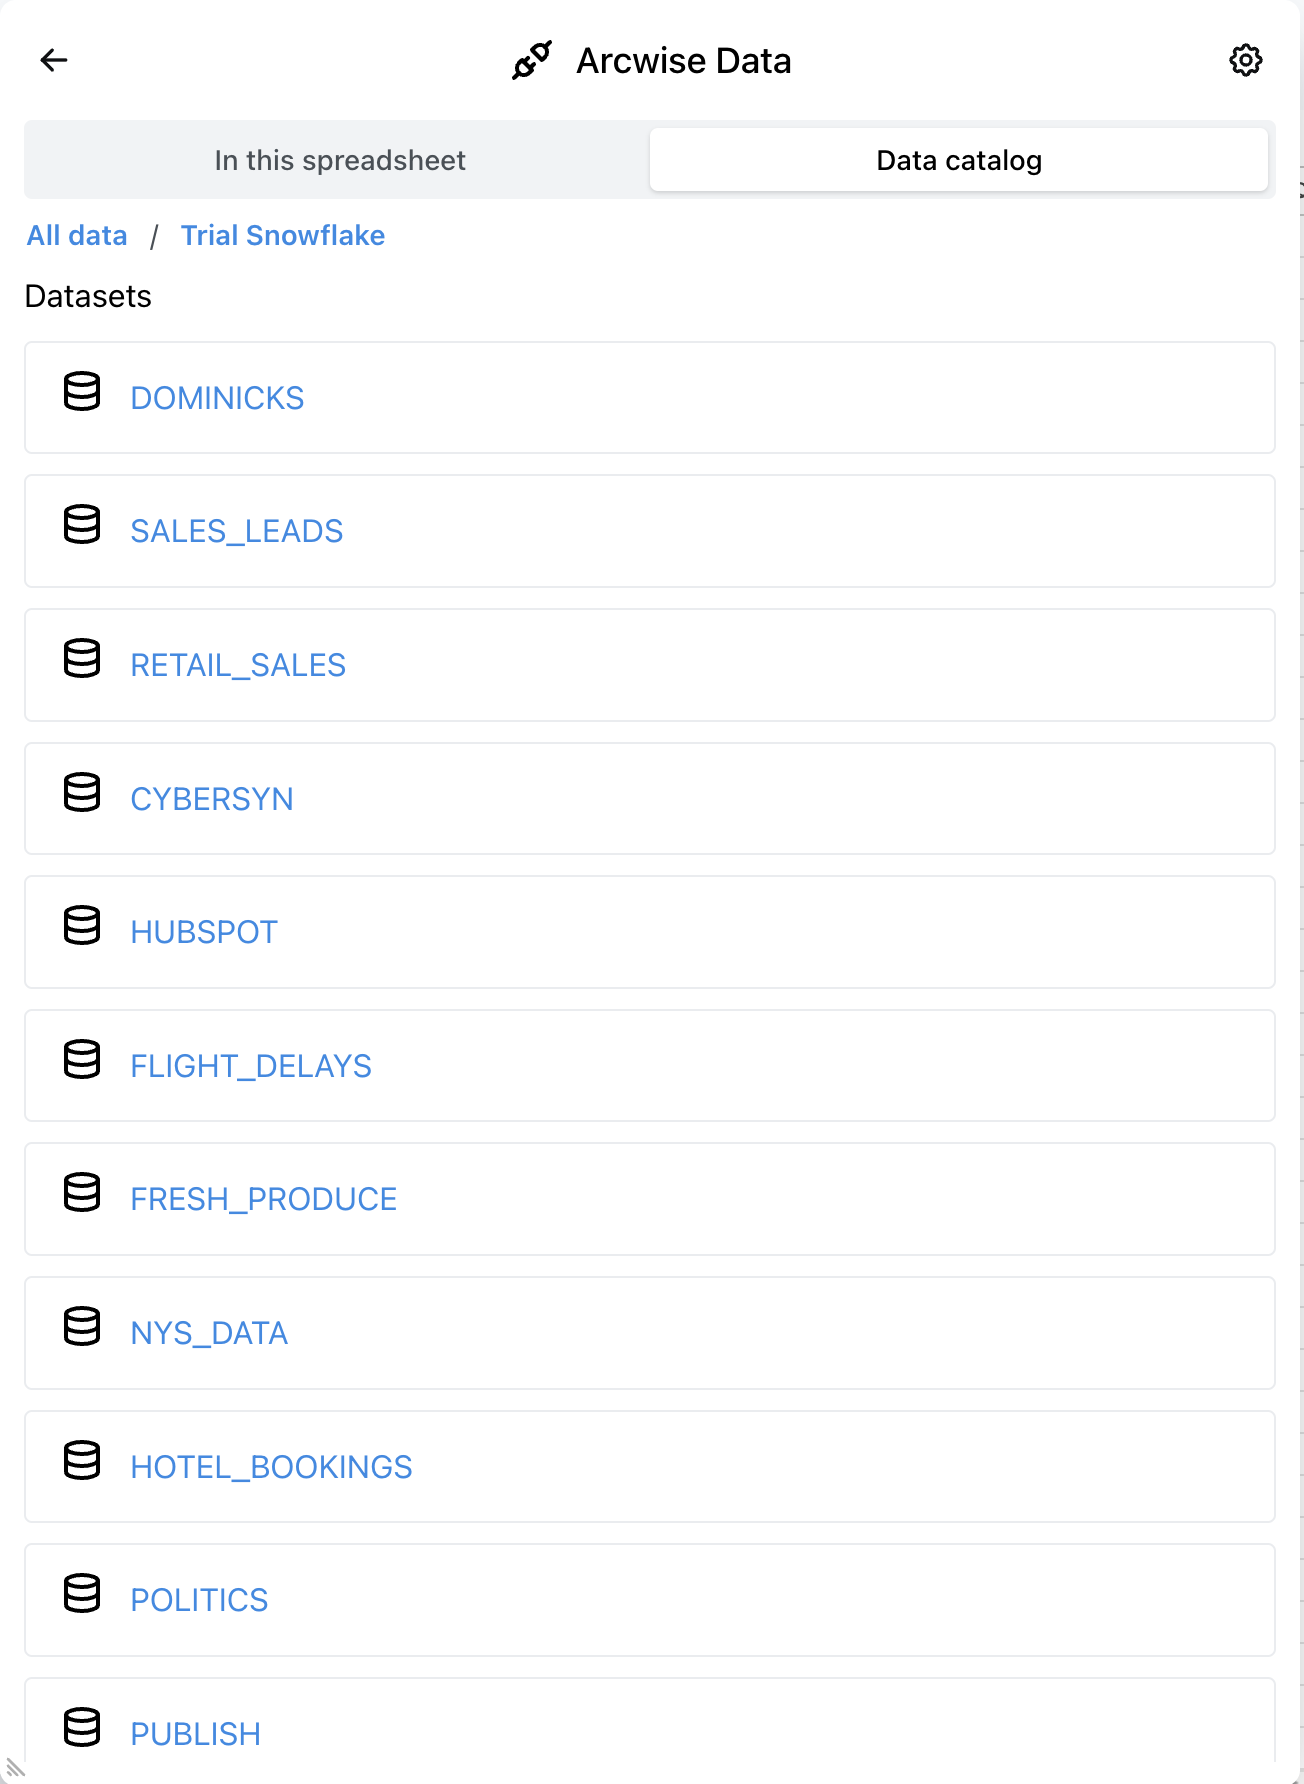
4\) (Optional) If you have multiple data warehouses select the data warehouse you would like to pull data from.

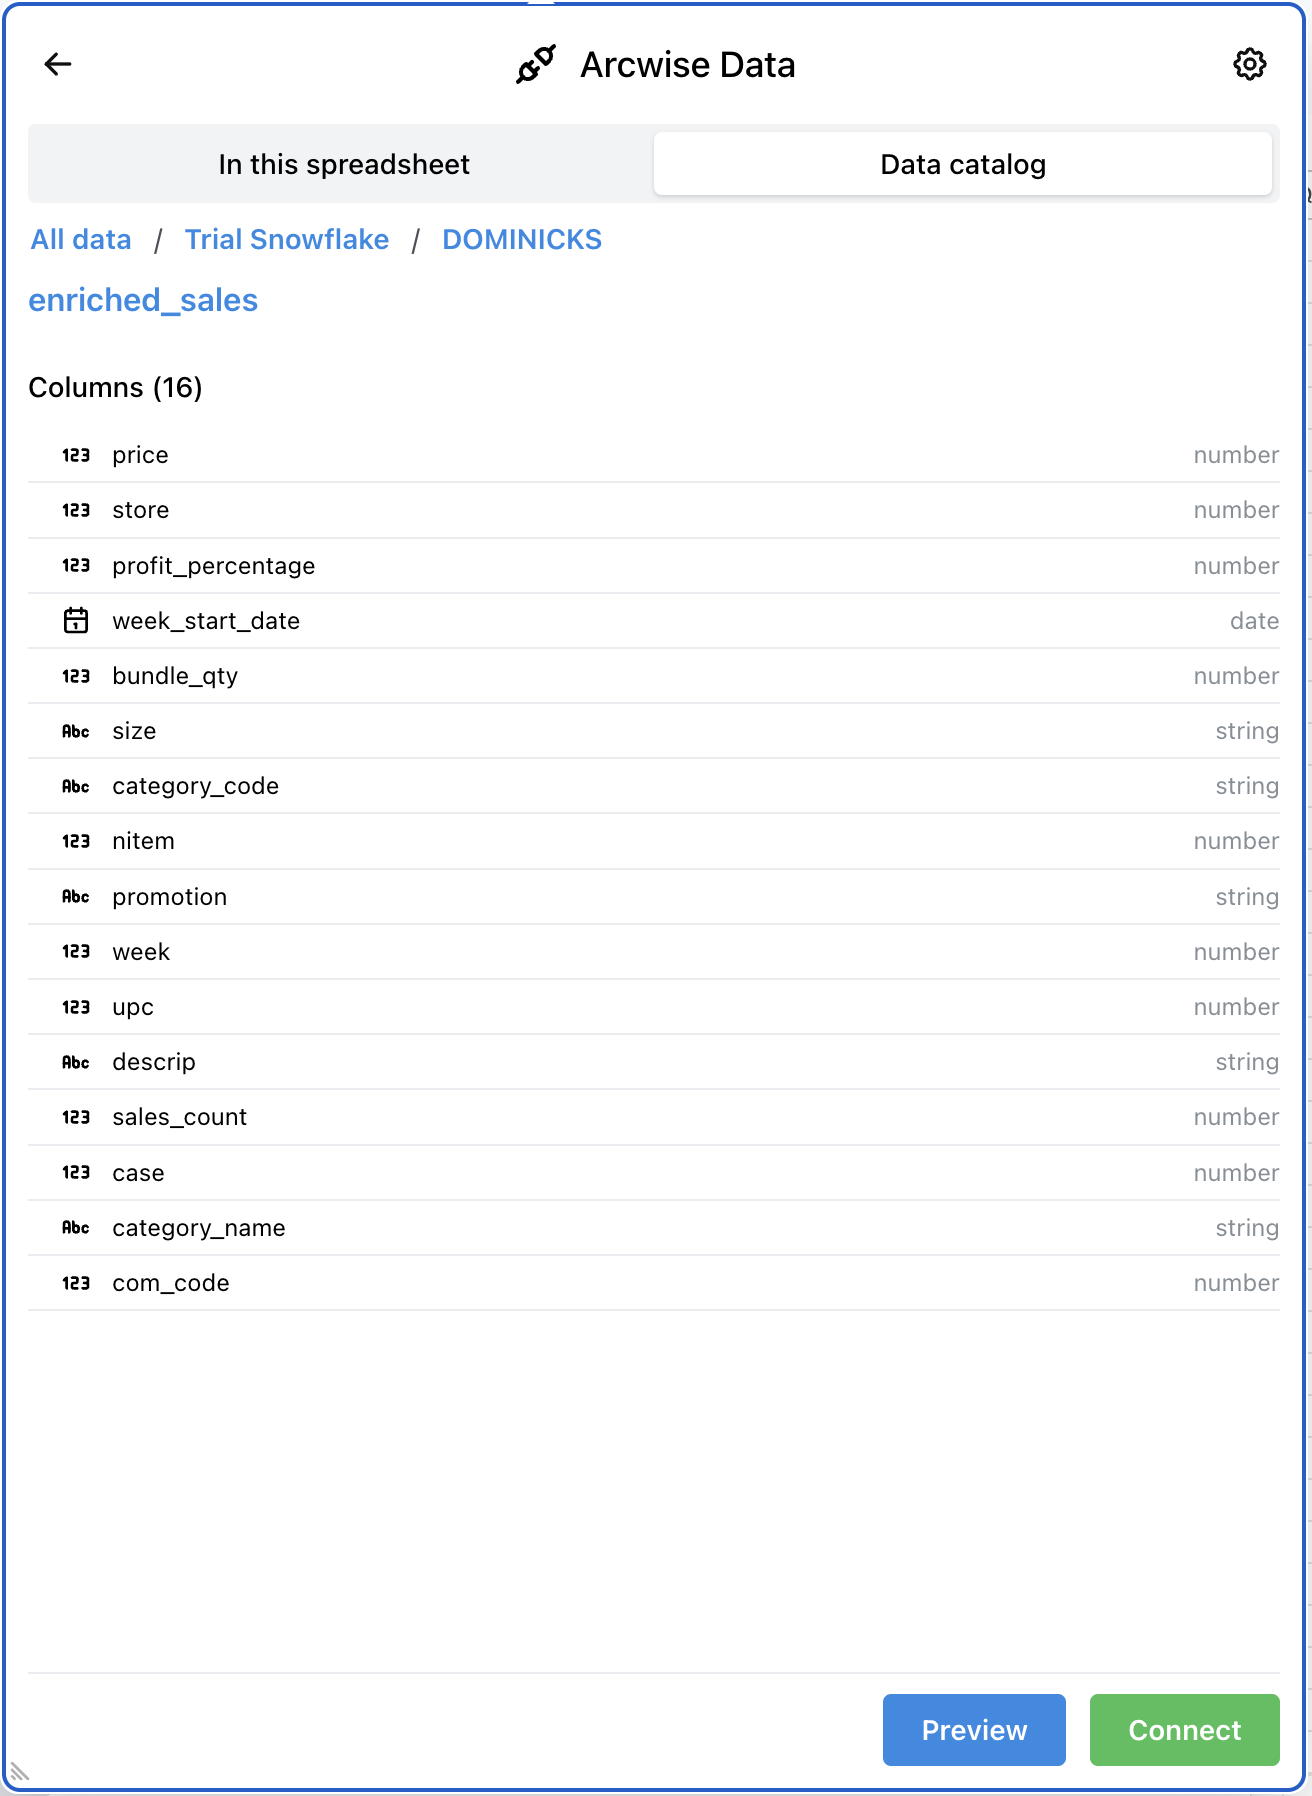
5\) Select the schema the contains your table and then the table you would like to connect.

<figure><img src="/files/pVQbmaikoDYpWGEymTW5" alt="" width="375"><figcaption></figcaption></figure>

6\) In the bottom right corner click the green **Connect** button.

<figure><img src="/files/d5v1YxsJ3ouRWDC8VzxE" alt="" width="375"><figcaption></figcaption></figure>
{% endtab %}

{% tab title="Connect Data" %}
1\) Navigate to the Arcwise icon at the top right corner of your sheet and click it.

<div data-full-width="false"><figure><img src="/files/vJPKMaDbBN9AqoCWEH6h" alt="" width="363"><figcaption><p>The Arcwise icon appears at the top right of your Google Sheet</p></figcaption></figure></div>

2\) From the command palette select **Connect data** near the bottom.

<figure><img src="/files/f8XAPvNhoT47IOv0890m" alt="" width="375"><figcaption></figcaption></figure>

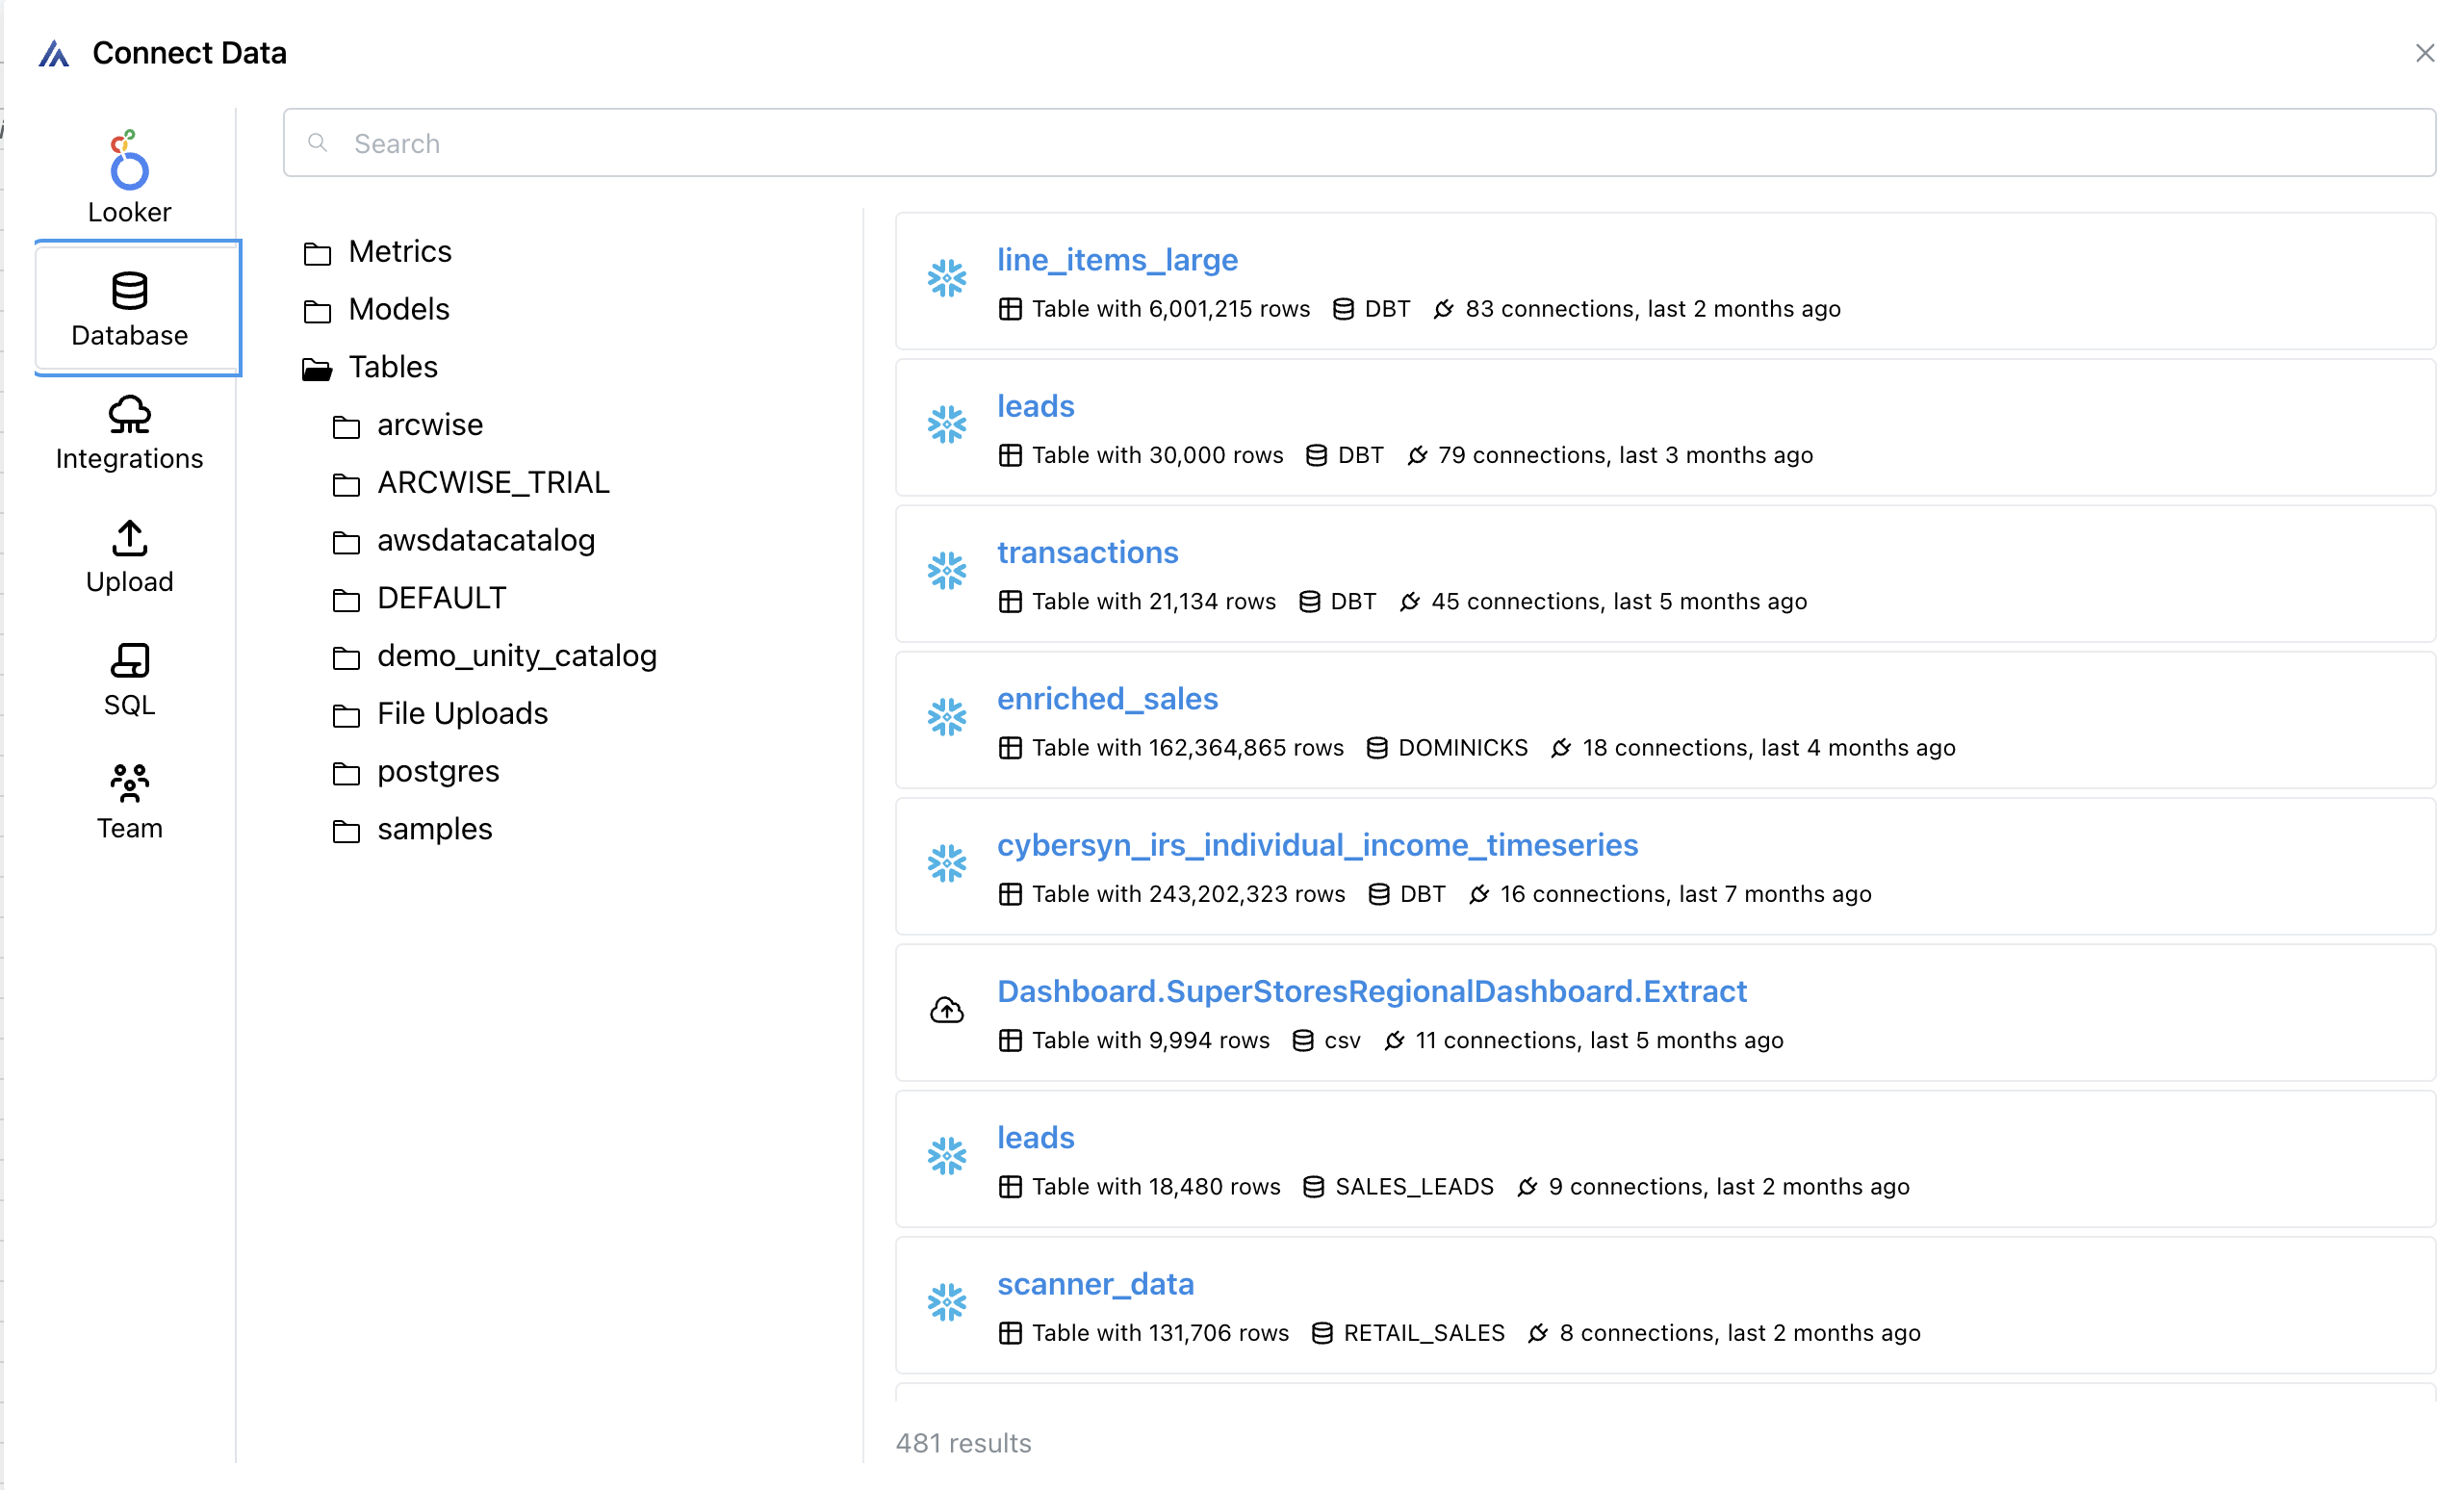
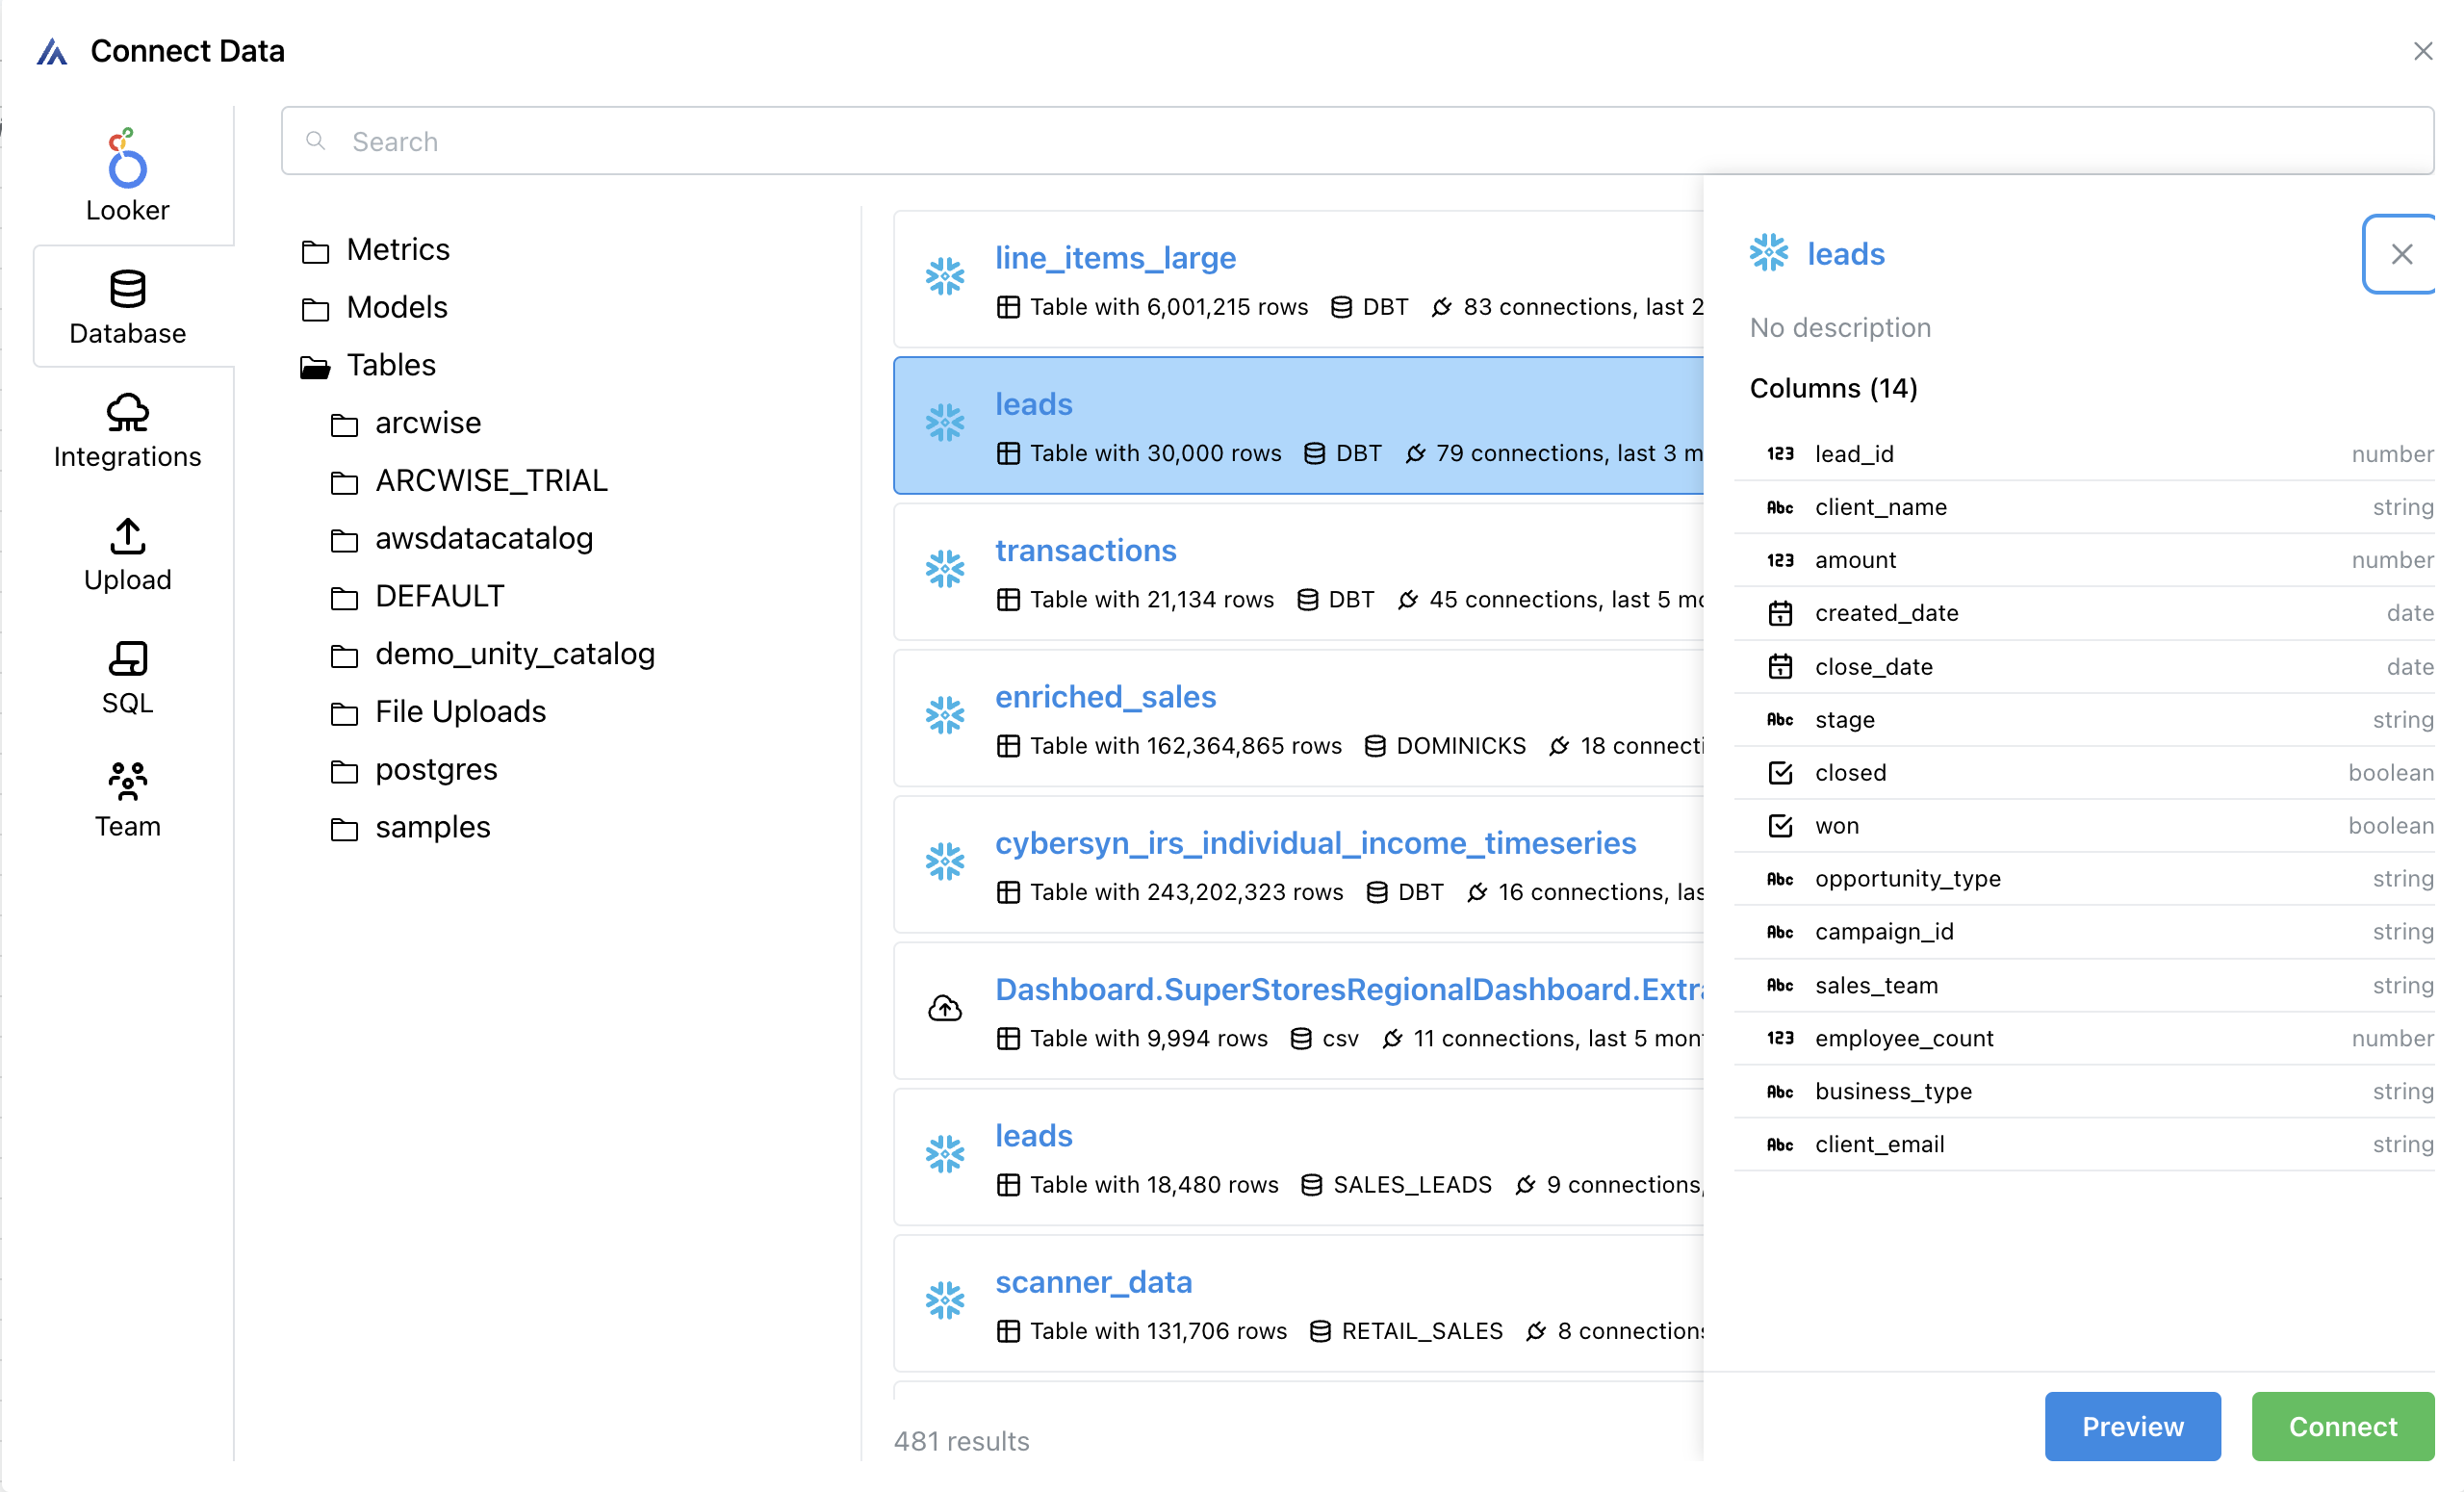
4\) Click on the **Database** section.

<figure><img src="/files/5tyAHIXCv7Z9QzXsnsSm" alt="" width="563"><figcaption></figcaption></figure>

5\) (Optional) search and use the navigation panel to find the data that is most relevant for your task.

6\) Select the table you would like to connect and click the green **Connect** button in the bottom right corner.

<figure><img src="/files/36yA5Qyw46VJRDD3QV5D" alt="" width="563"><figcaption></figcaption></figure>
{% endtab %}

{% tab title="AI" %}
[Getting Data Using AI](/using-arcwise-ai-analyst/getting-data-using-ai)
{% endtab %}
{% endtabs %}


# Uploading CSV Files

Arcwise lets users upload CSV and TSV files. These files can then be joined with other data from your data warehouse or other connected tools (Salesforce, Netsuite, etc.).

Uploading data as a CSV through Arcwise also makes it easier to work with via AI and makes the AI more effective on that data.

Currently, only files up to 1GB are supported, although this limit can be increased by reaching our directly to your Arcwise administrator or the Arcwise team.

{% hint style="info" %}
If your data is large the data in the sheet will be truncated to 100 rows. You can still work with this data, however! See [Working With Large Data](/using-arcwise-in-sheets/working-with-large-data).
{% endhint %}

## Uploading a CSV or TSV

1\) Navigate to the Arcwise icon at the top right corner of your sheet and click it.

<div data-full-width="false"><figure><img src="/files/vJPKMaDbBN9AqoCWEH6h" alt="" width="363"><figcaption><p>The Arcwise icon appears at the top right of your Google Sheet</p></figcaption></figure></div>

2\) From the command palette select **Connect data** at the bottom

<figure><img src="/files/f8XAPvNhoT47IOv0890m" alt="" width="375"><figcaption></figcaption></figure>

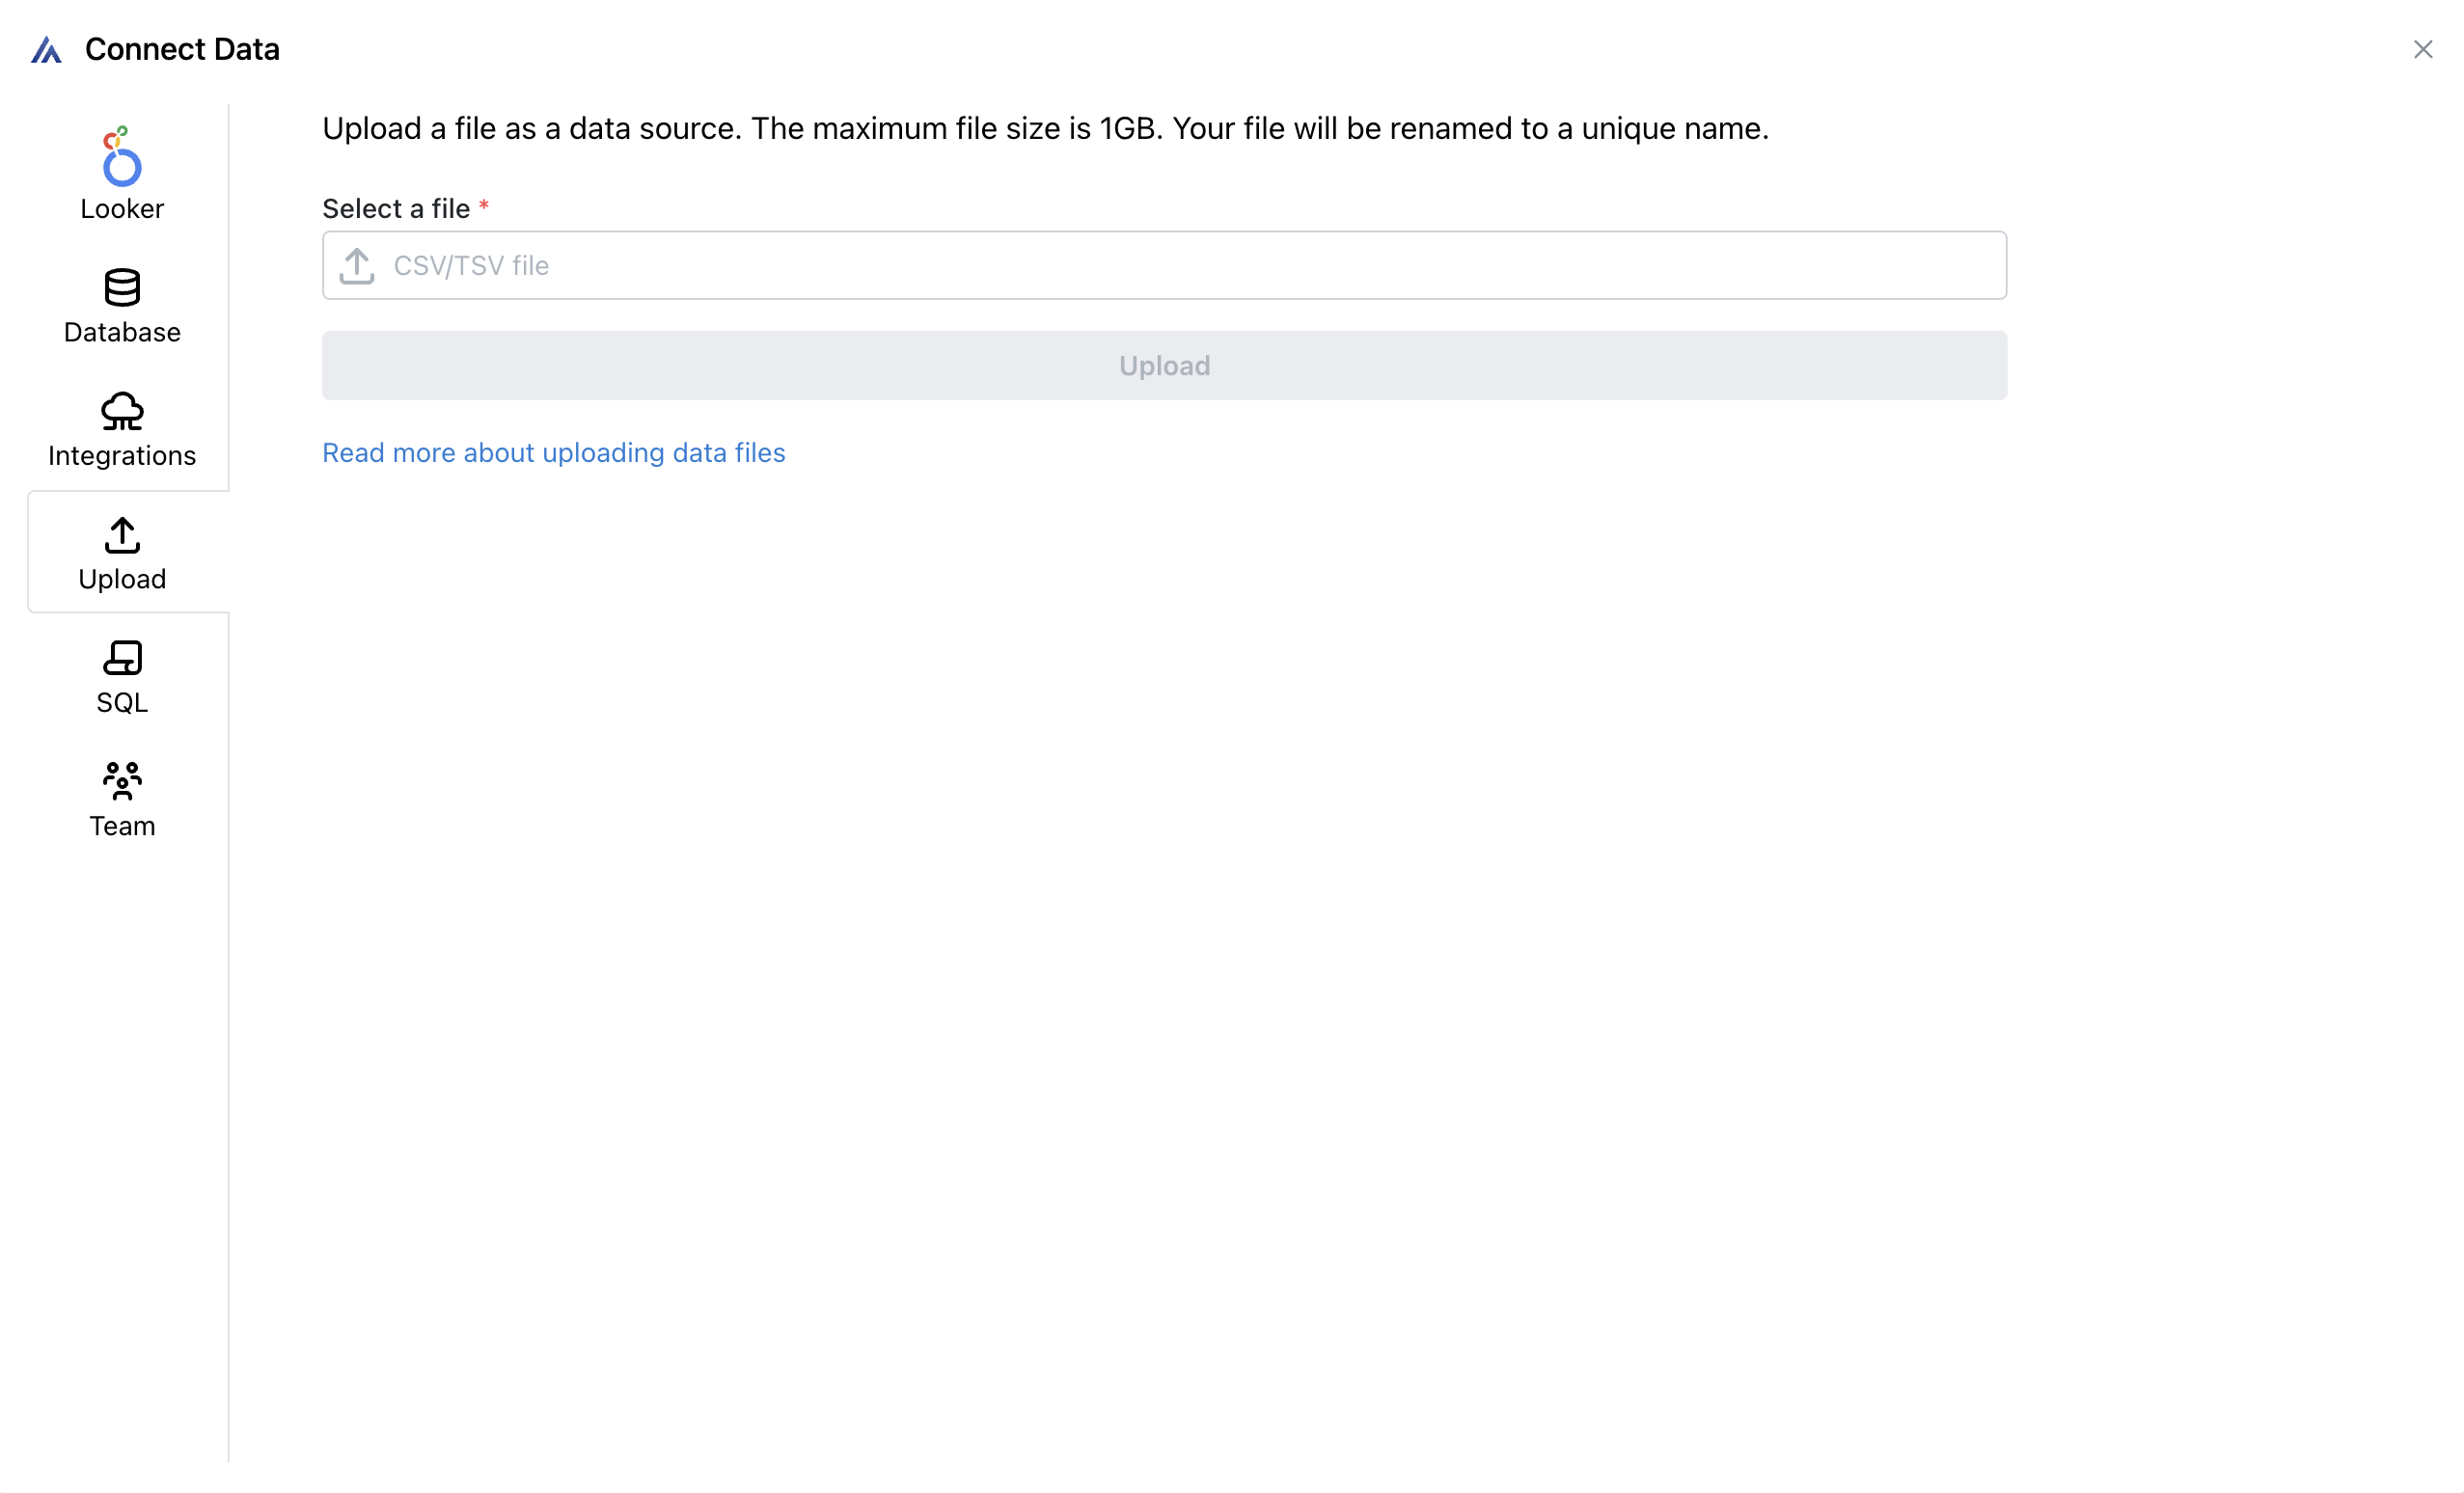
3\) From the pop up navigate to **Upload** and select the CSV or TSV file you would like to upload.

<figure><img src="/files/a1LHMsGHZE4RpqqkwhUq" alt="" width="563"><figcaption></figcaption></figure>

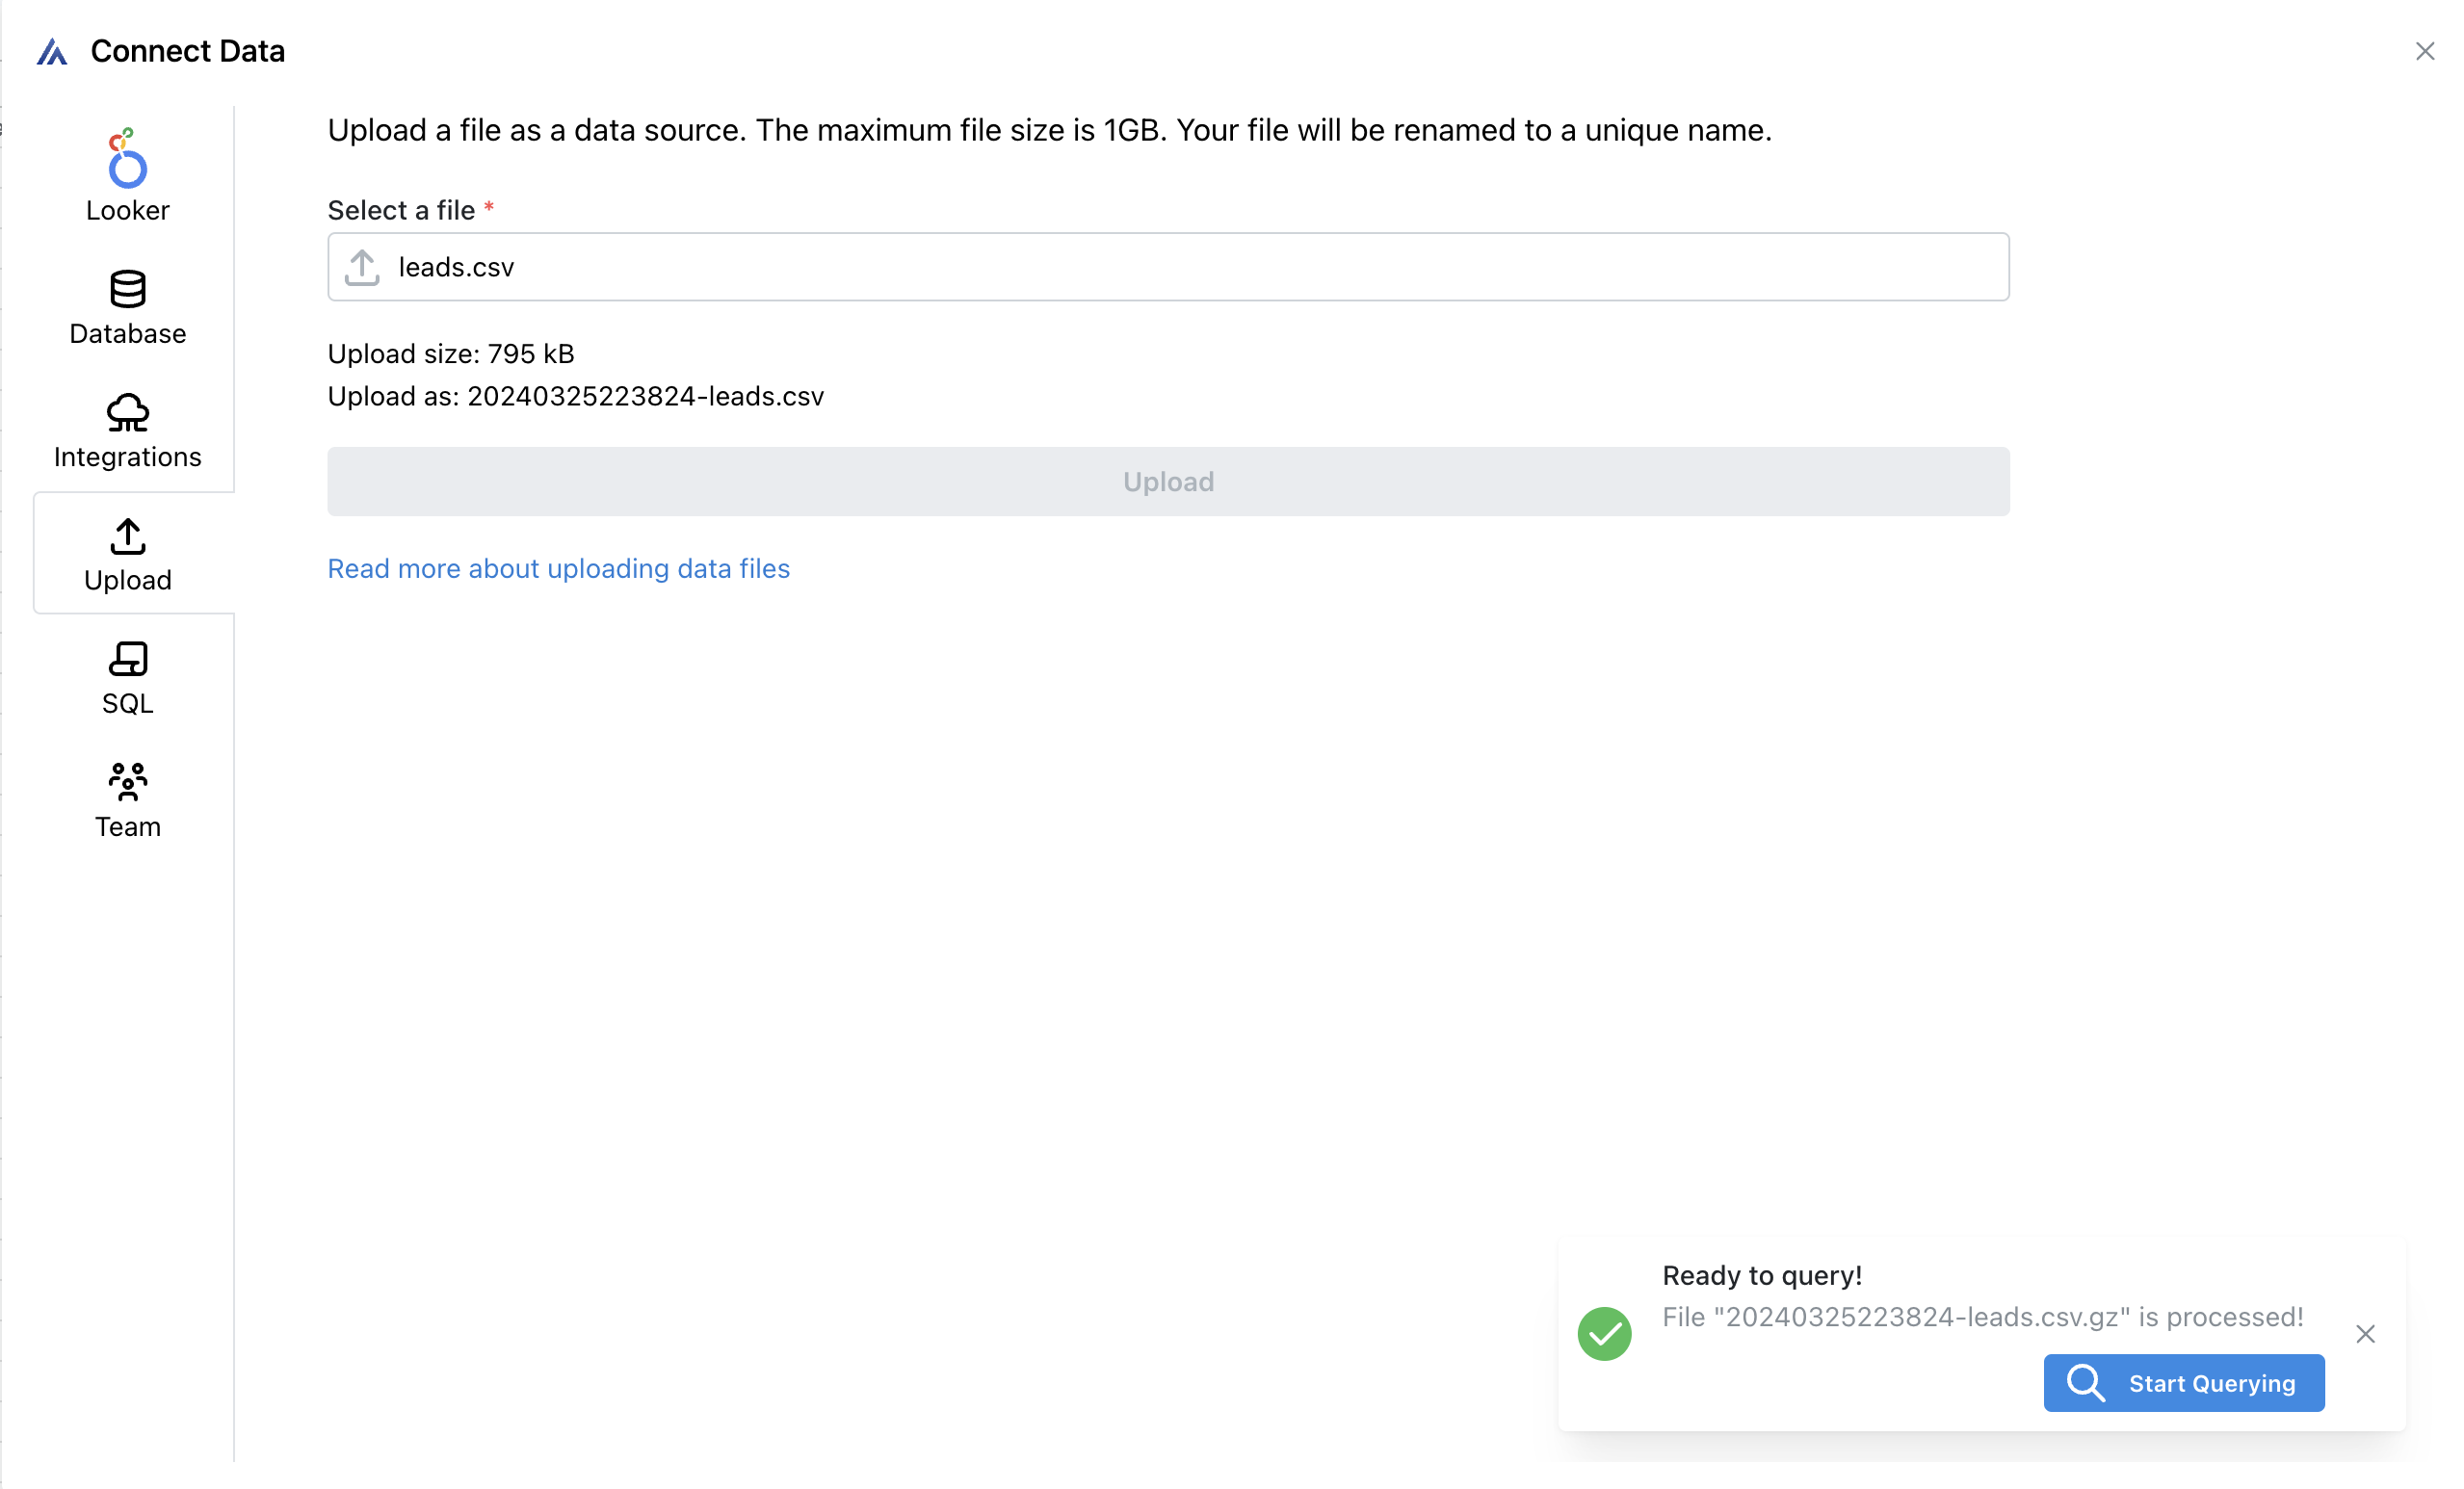
4\) After uploading the file a small pop up will appear in the bottom right corner. Click the blue **Start Querying** button.

<figure><img src="/files/ca4RwFitujfI7mQczMgW" alt="" width="563"><figcaption></figcaption></figure>

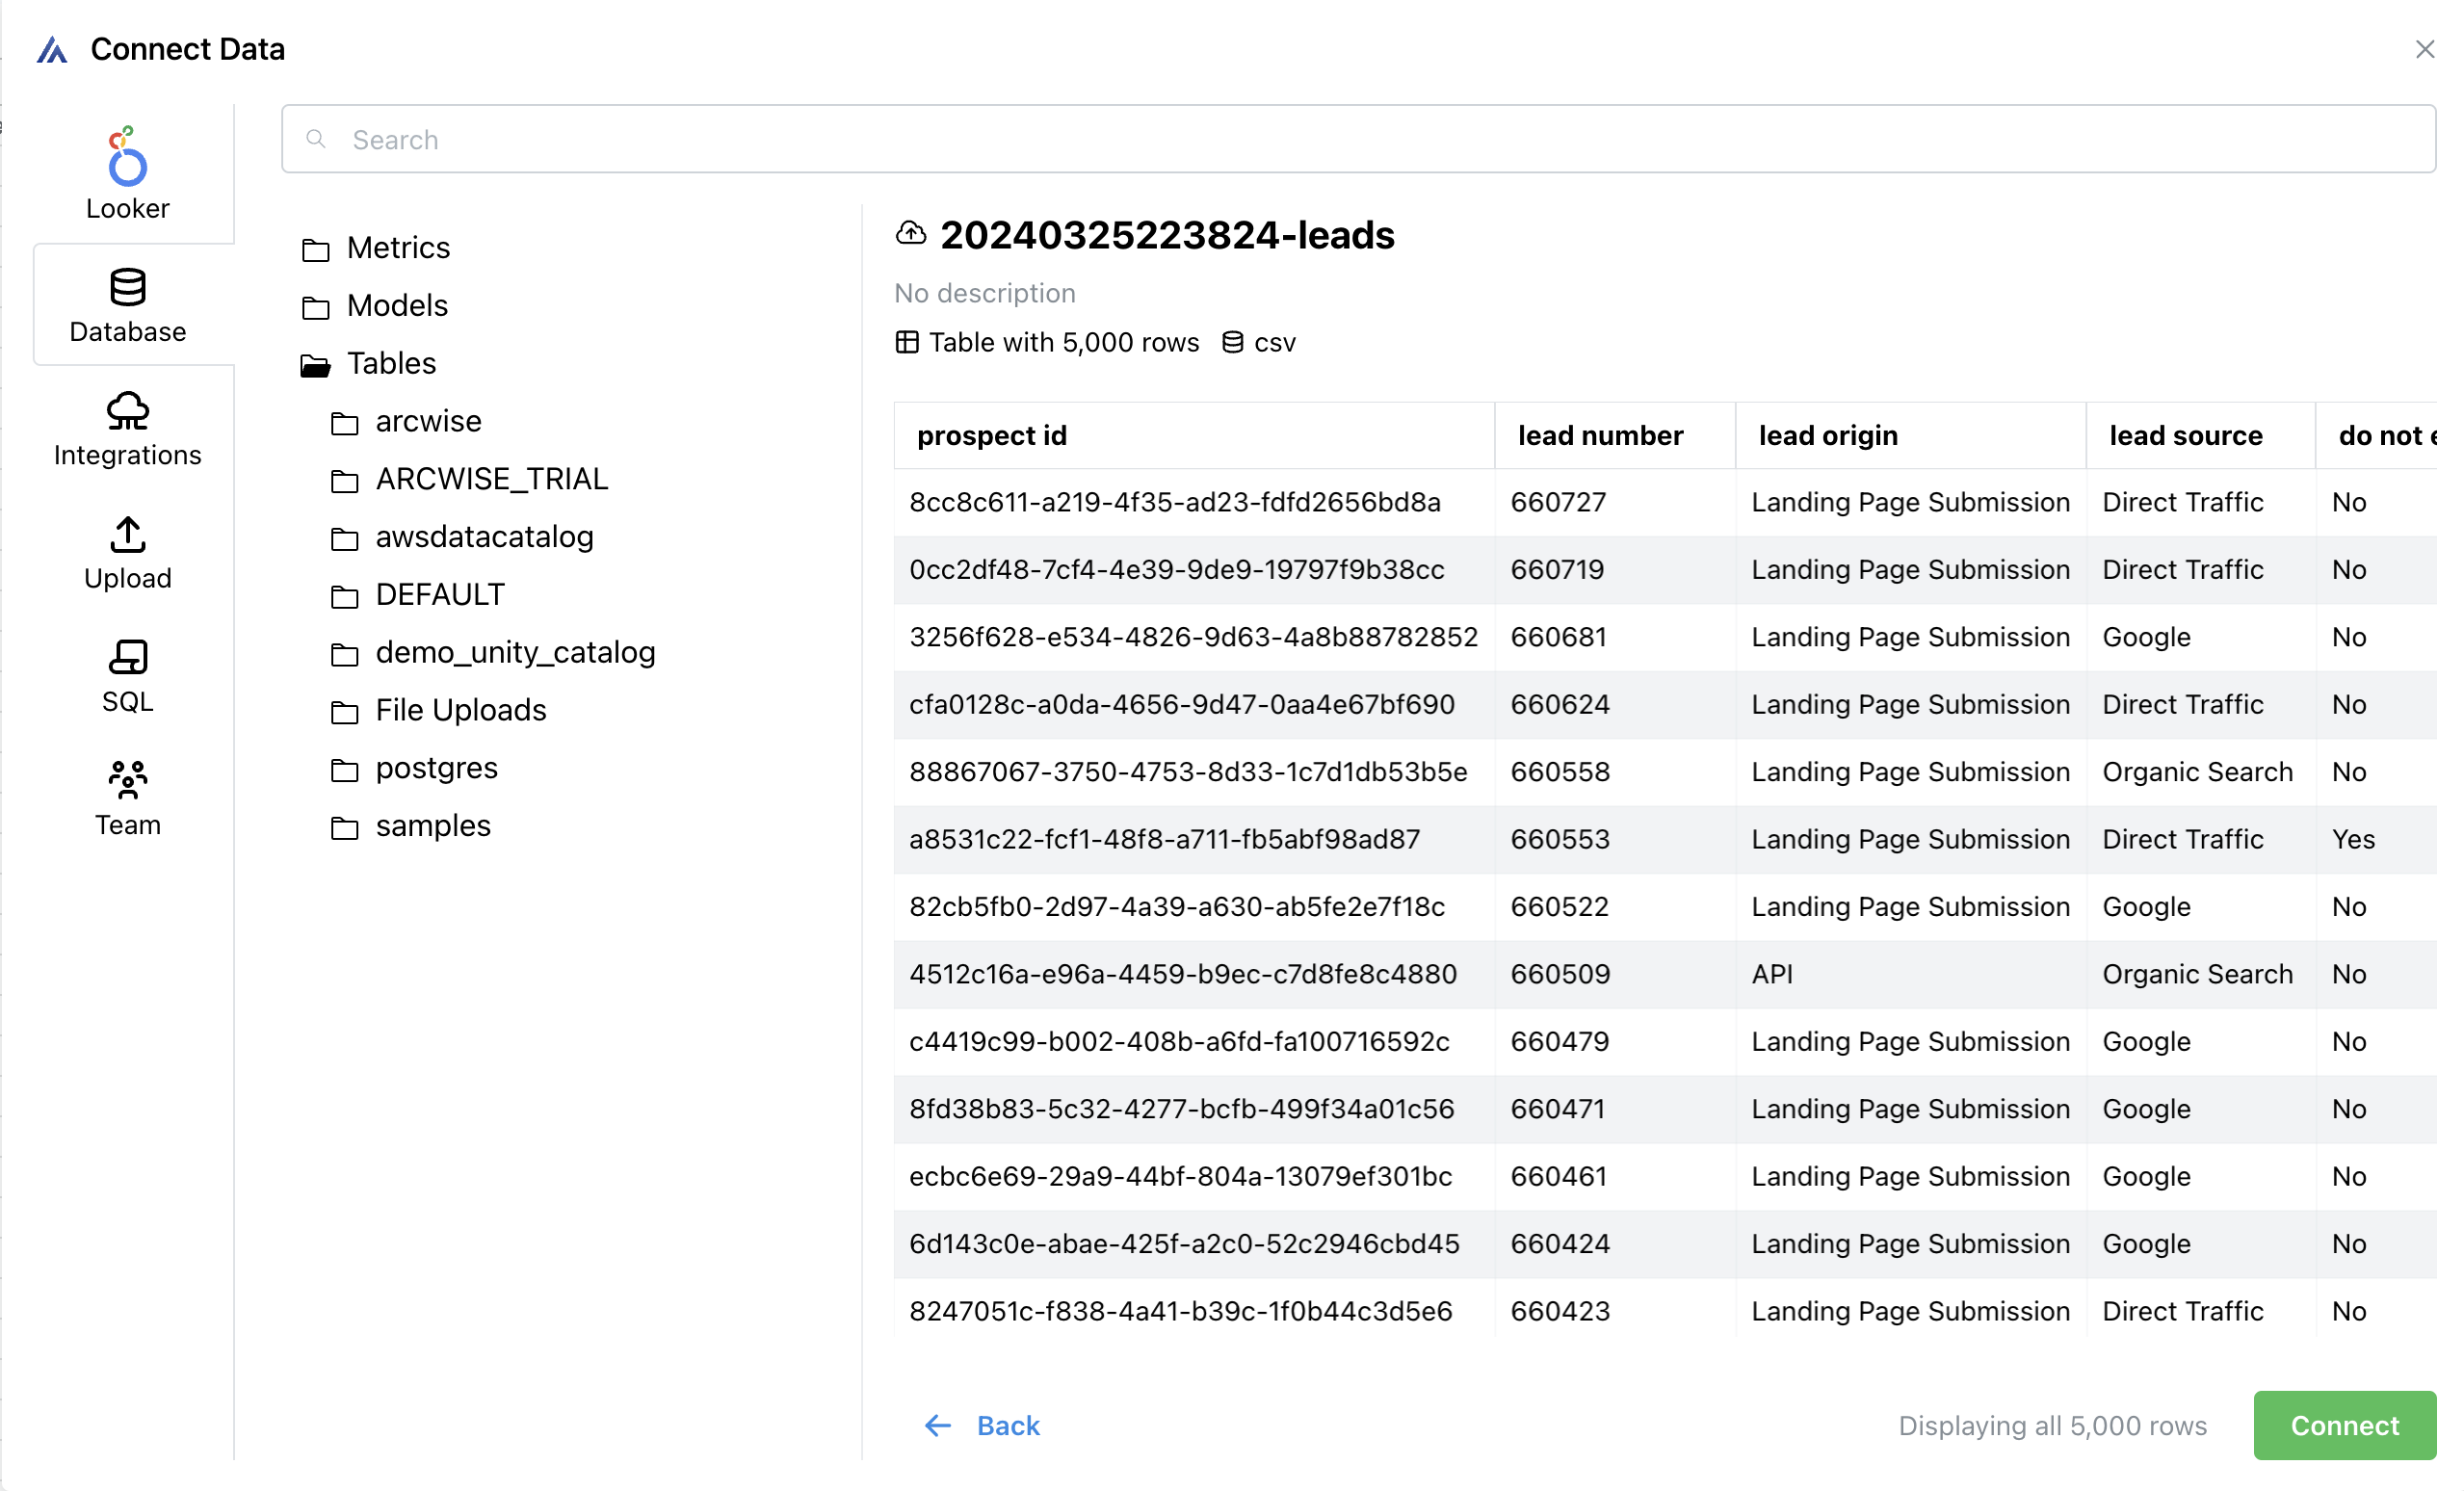
5\) A preview of the data will appear. From this screen click the green **Connect** button. This will place the data in a new tab in your sheet.

<figure><img src="/files/3Hrr5Agg4pi7tIz3TTzA" alt="" width="563"><figcaption></figcaption></figure>


# Importing Data from Other Tools


# Selecting Spreadsheet Data for AI Analysis


# Arcwise Connected Data

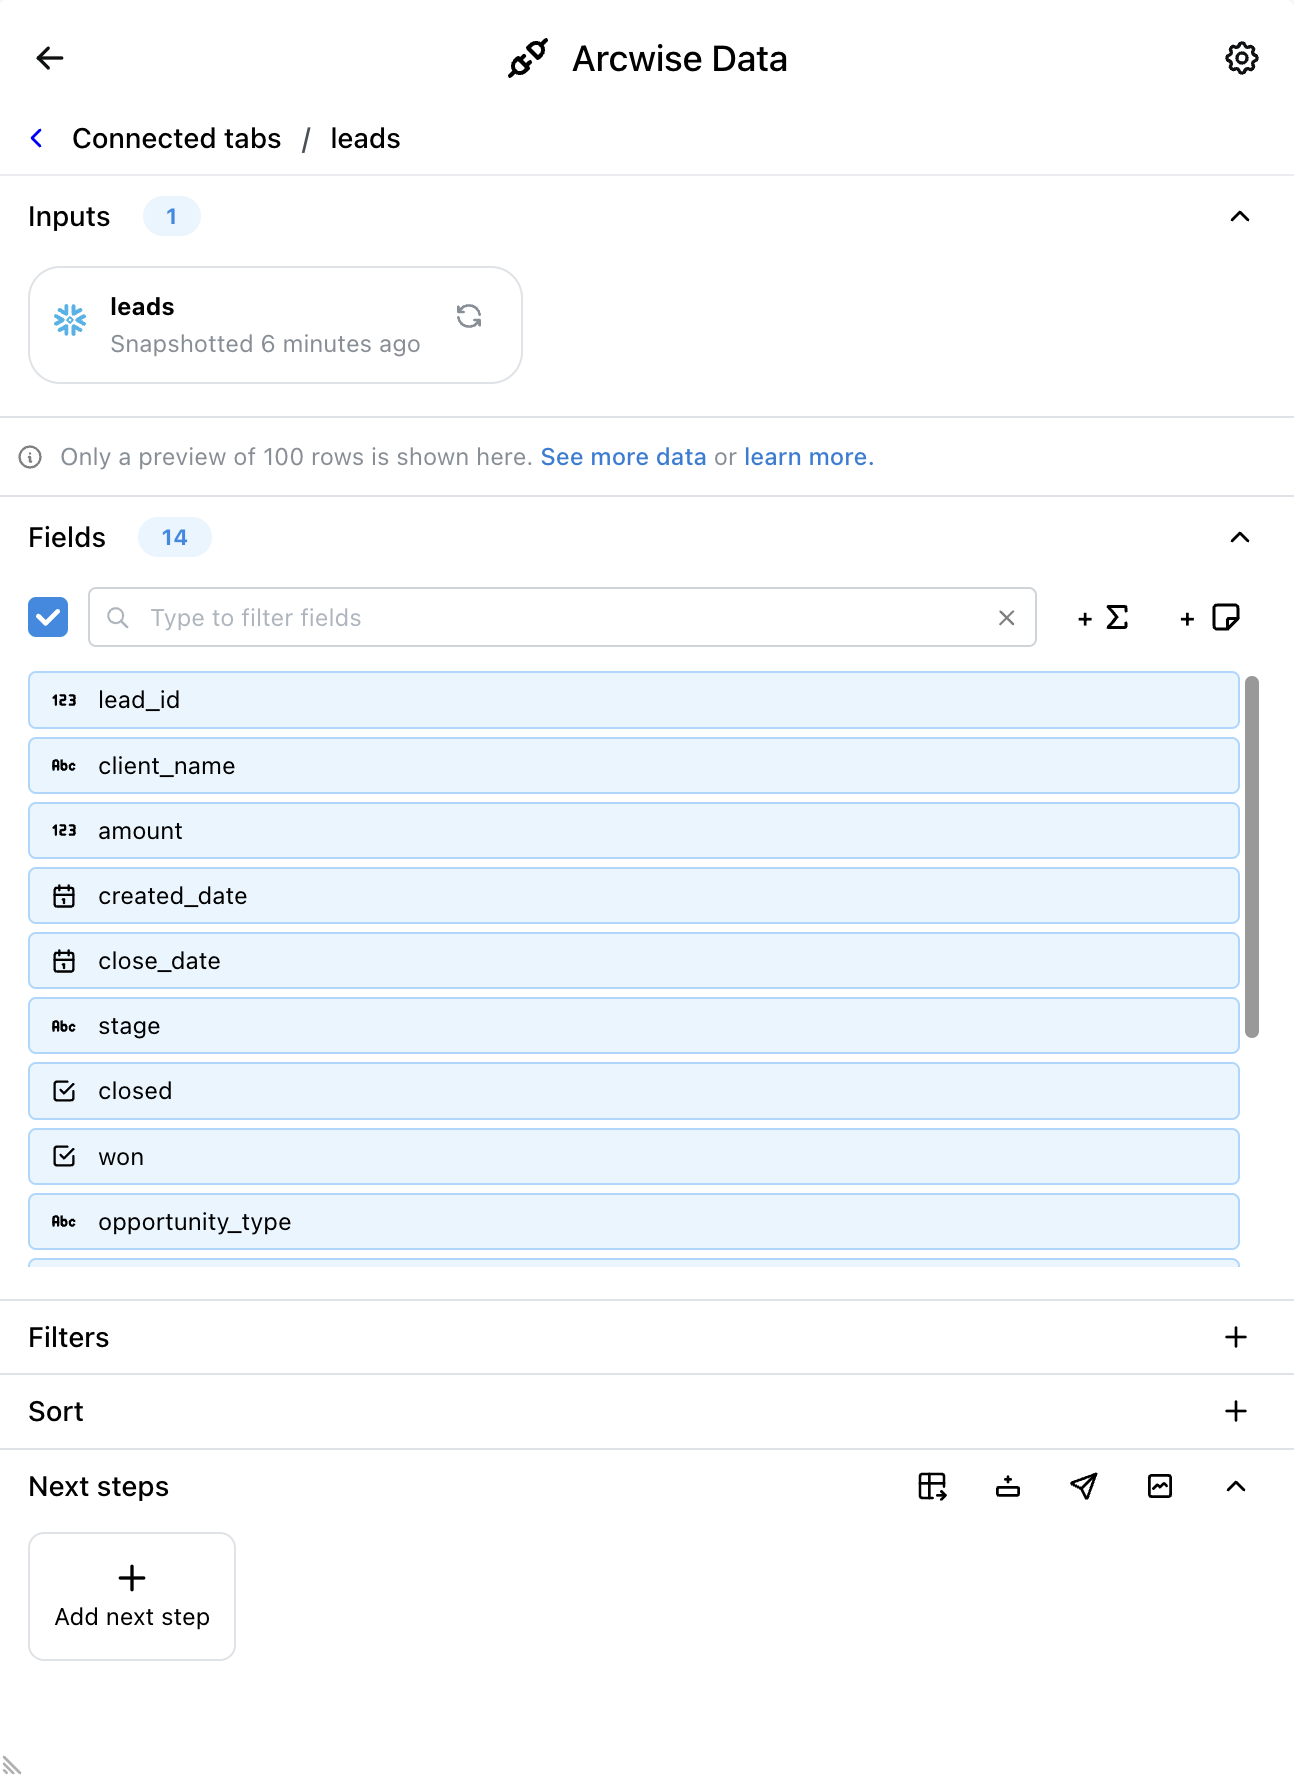
Every time you connect data using Arcwise you will see an Arcwise connected data tab. This data tab behaves like a normal spreadsheet tab in most cases. If the data is too large you will see a preview of the data but will still be able to work with the data: [Working With Large Data](/using-arcwise-in-sheets/working-with-large-data).

To interact with an Arcwise connected data tab you should use the Arcwise interface for that tab.

{% tabs %}
{% tab title="Using Google Sheets navigation" %}
1\) Navigate to the Arcwise connected data tab in Google Sheets

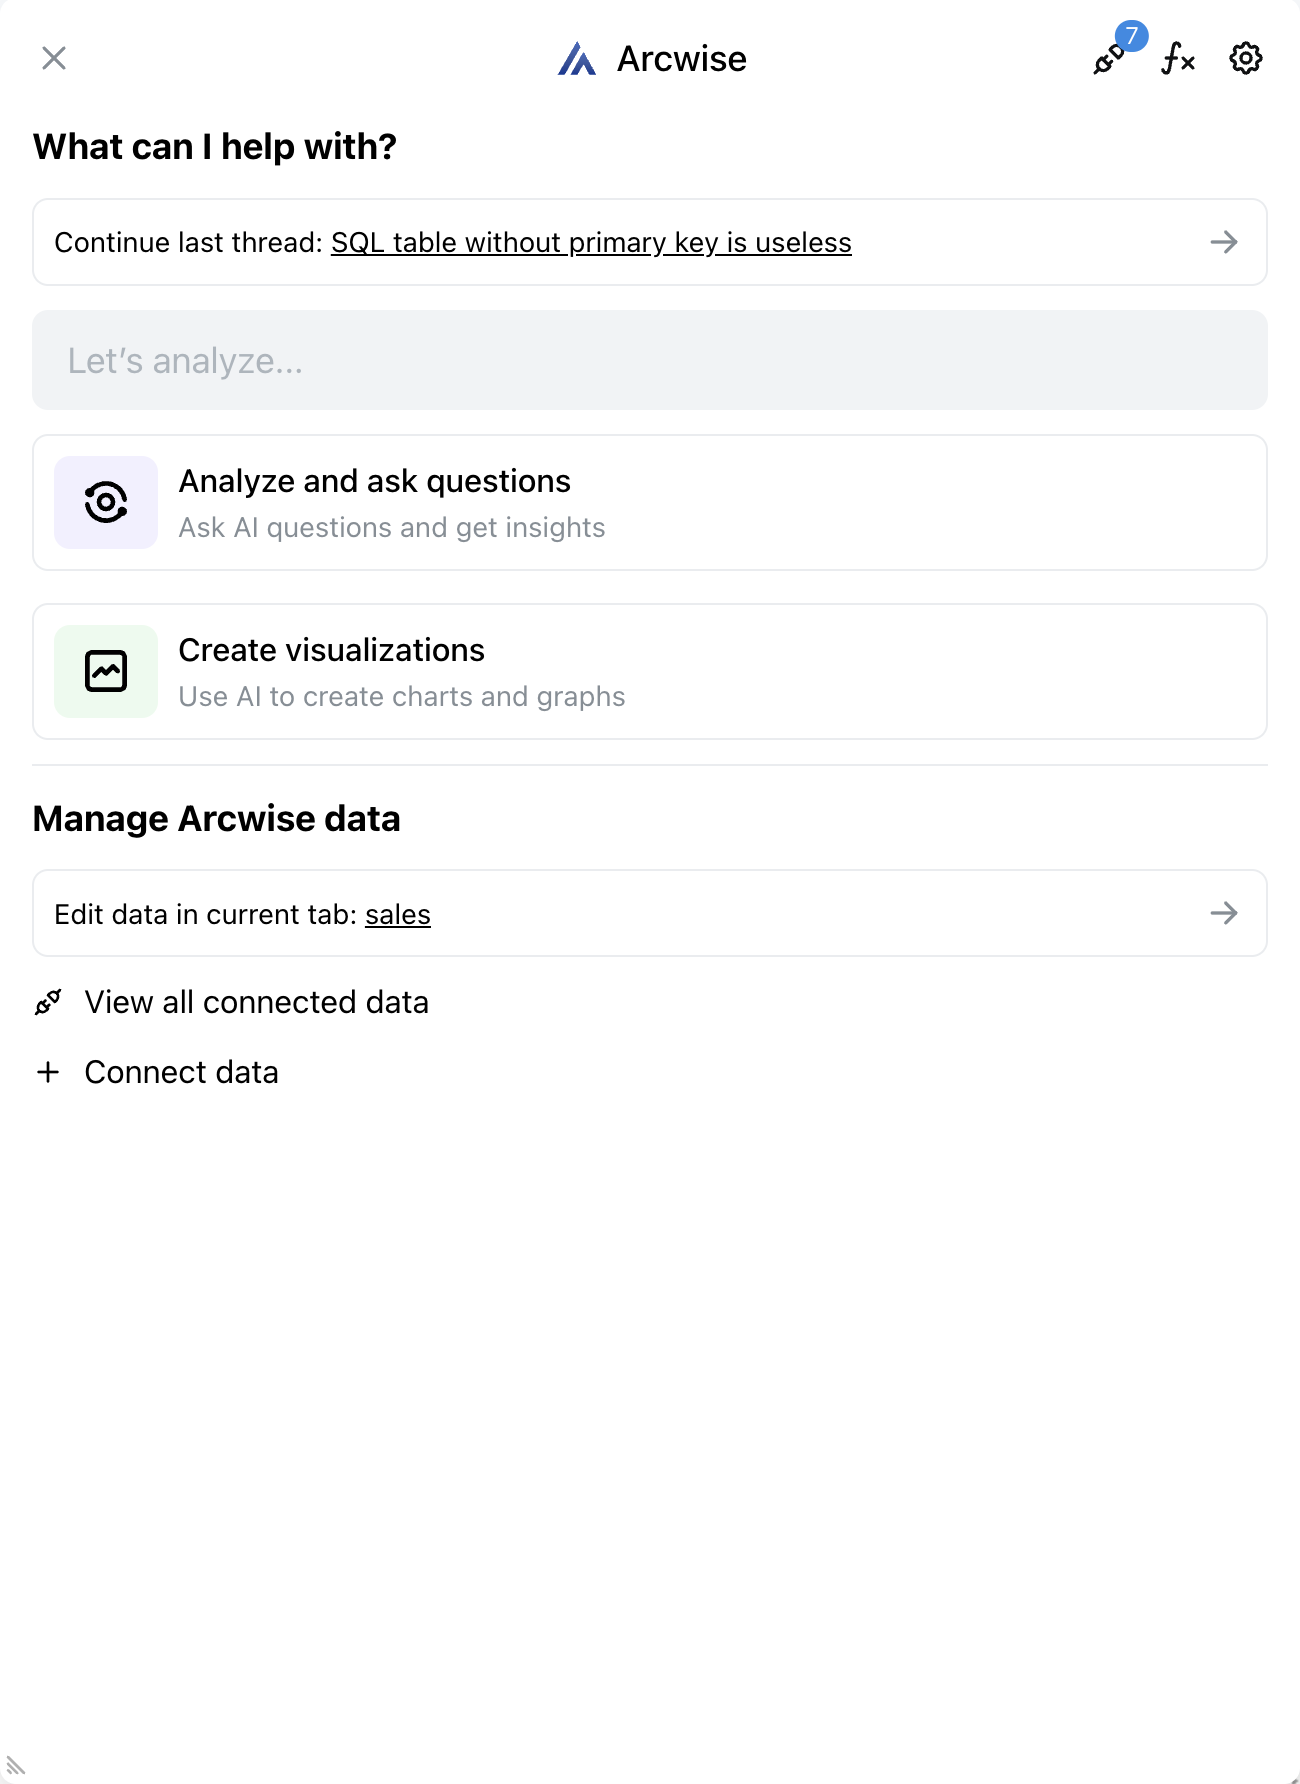
2\) Click **Edit data in current tab** in the **Manage Arcwise data** section

<figure><img src="/files/cT3hUJldzNwjinYeQAyL" alt="" width="375"><figcaption></figcaption></figure>
{% endtab %}

{% tab title="Using the connected data navigation" %}
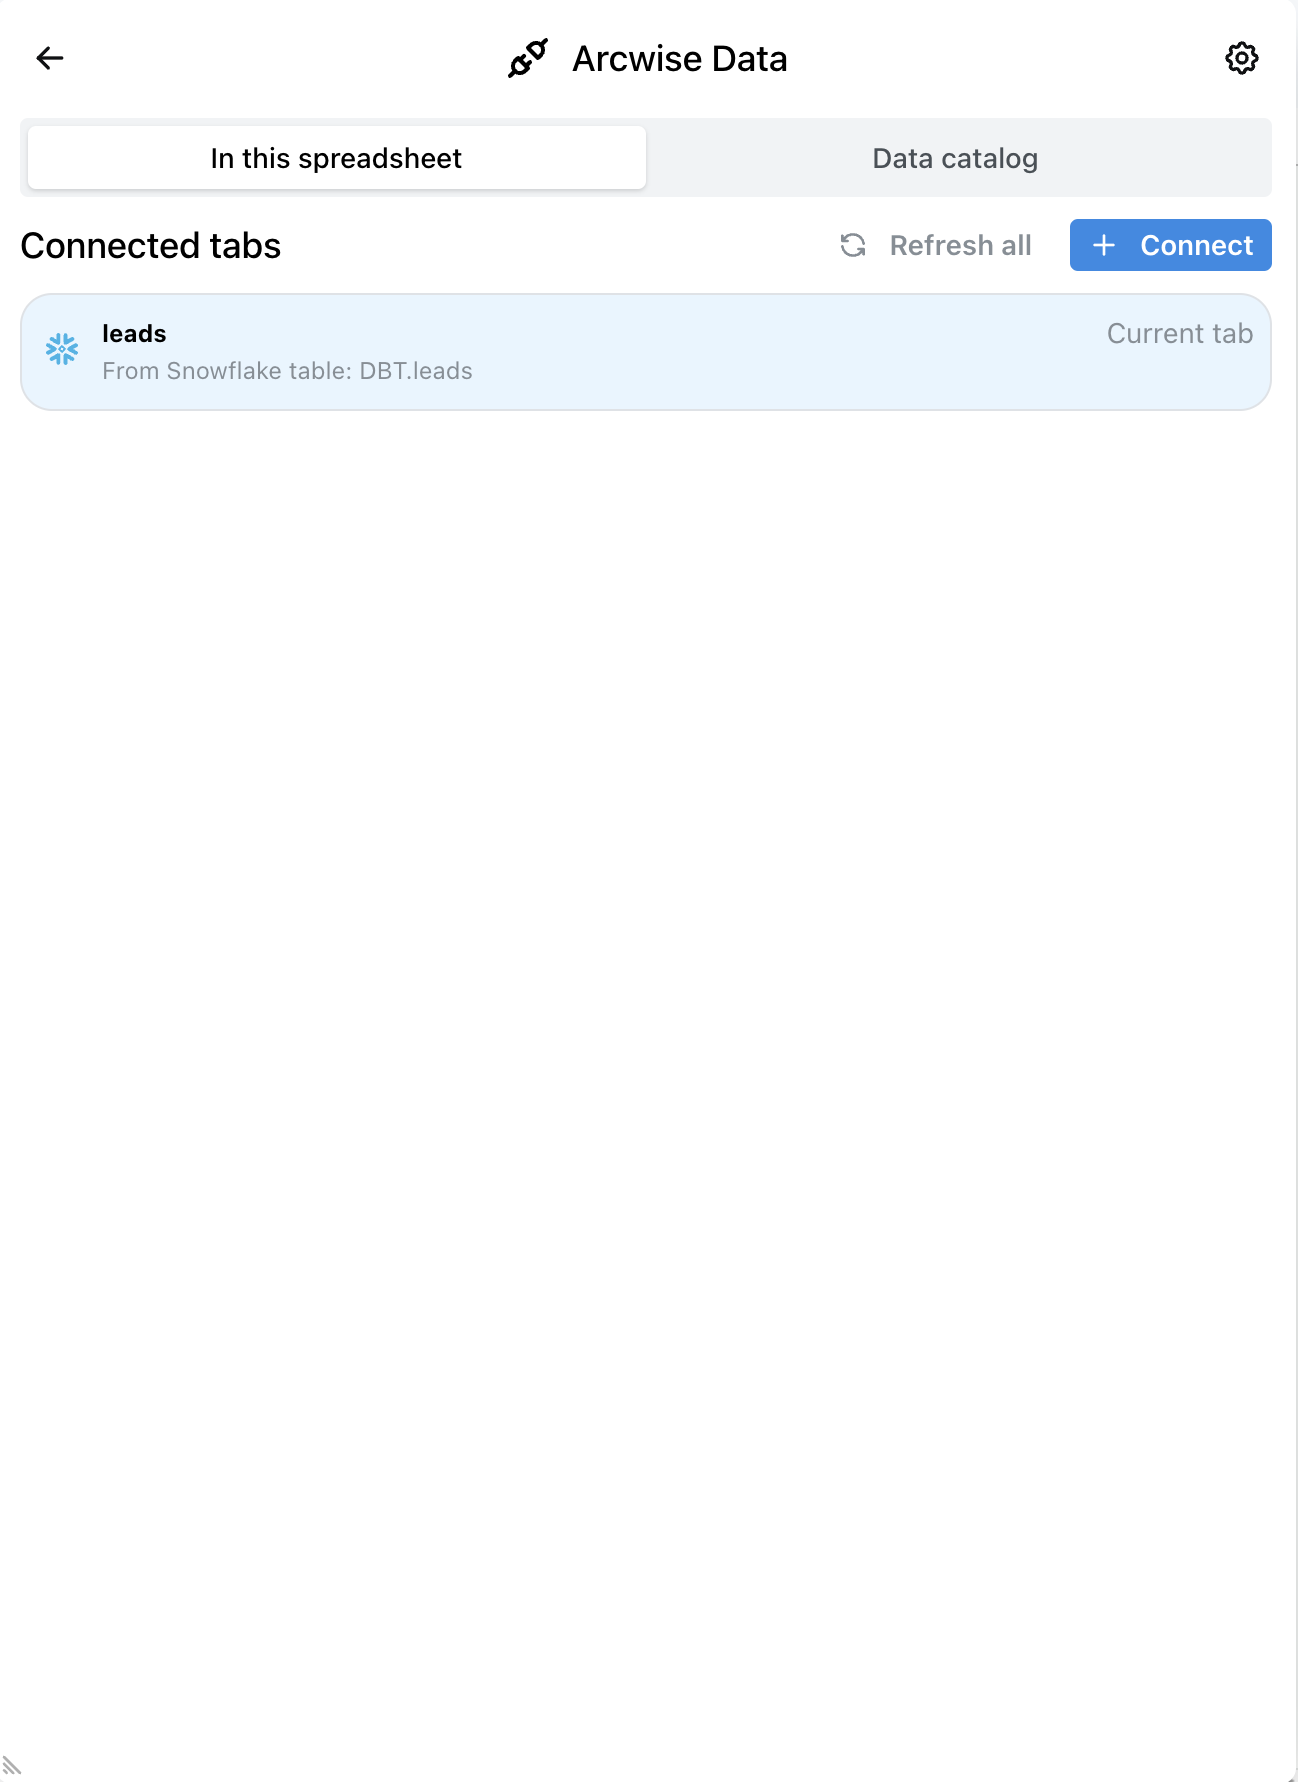
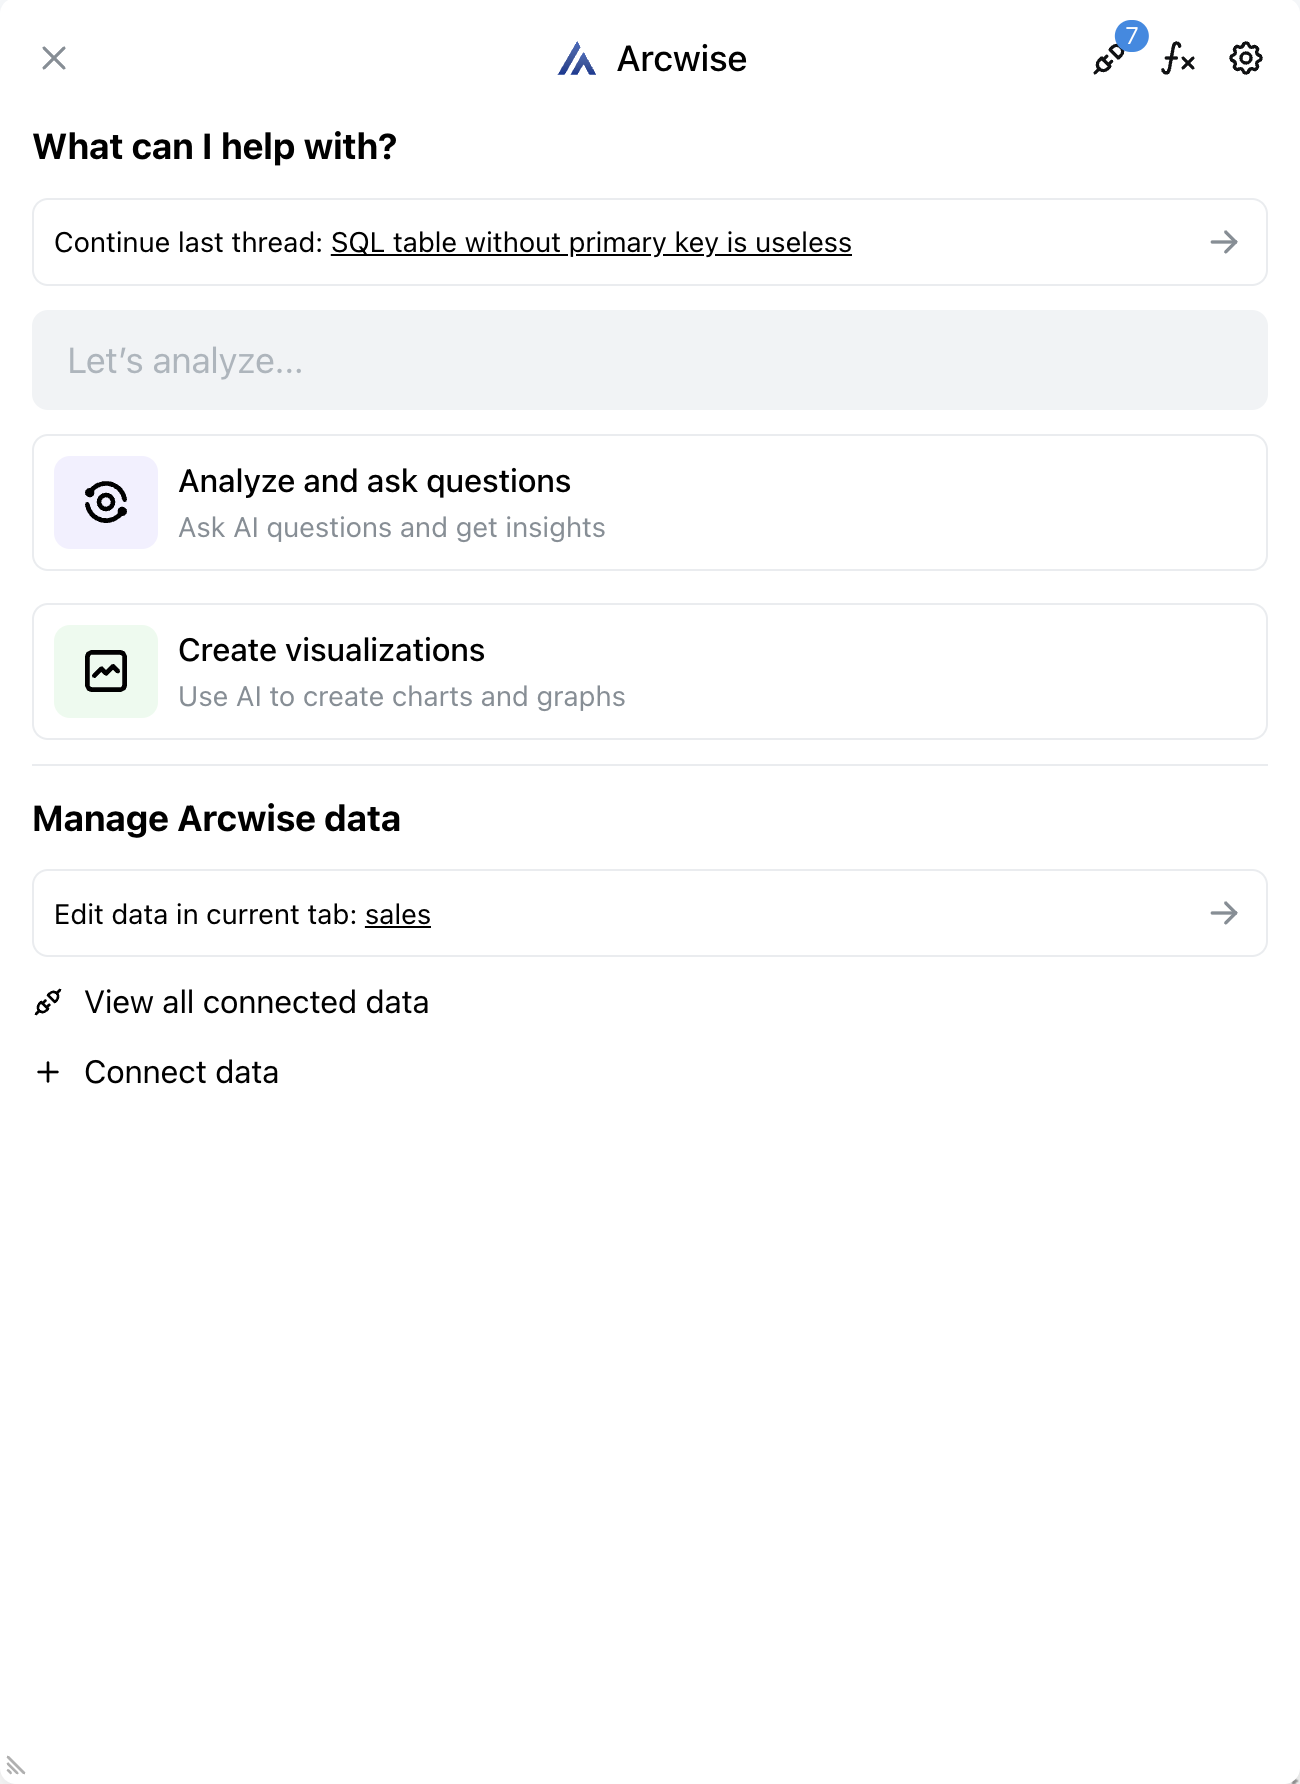
1\) From the command palette select **View all connected data** near the bottom. Alternatively, use the small connection icon in the top right corner.

<figure><img src="/files/f8XAPvNhoT47IOv0890m" alt="" width="375"><figcaption></figcaption></figure>

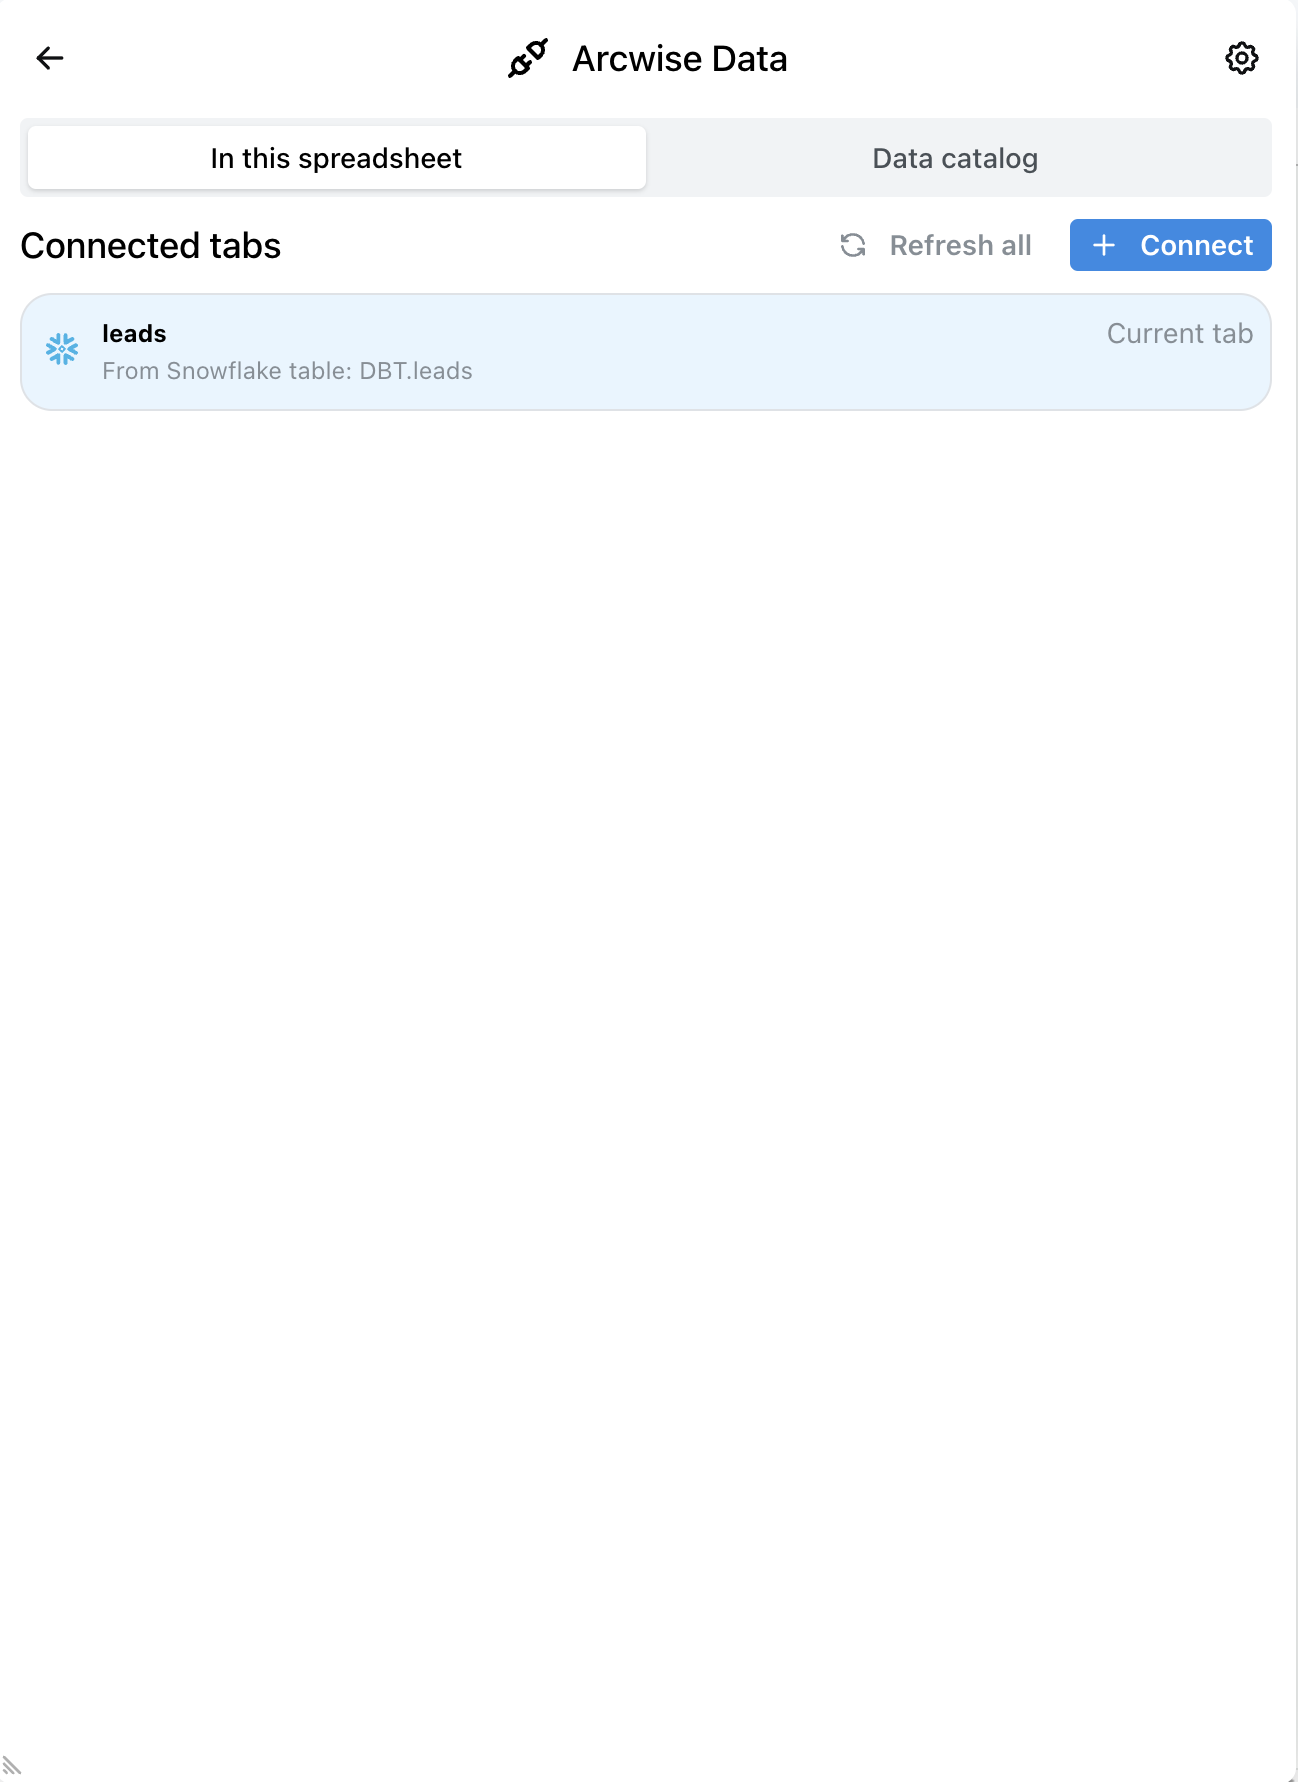
2\) Navigate to **In this spreadsheet**.

<figure><img src="/files/shHYTrSFnsgph01vwEya" alt="" width="375"><figcaption></figcaption></figure>

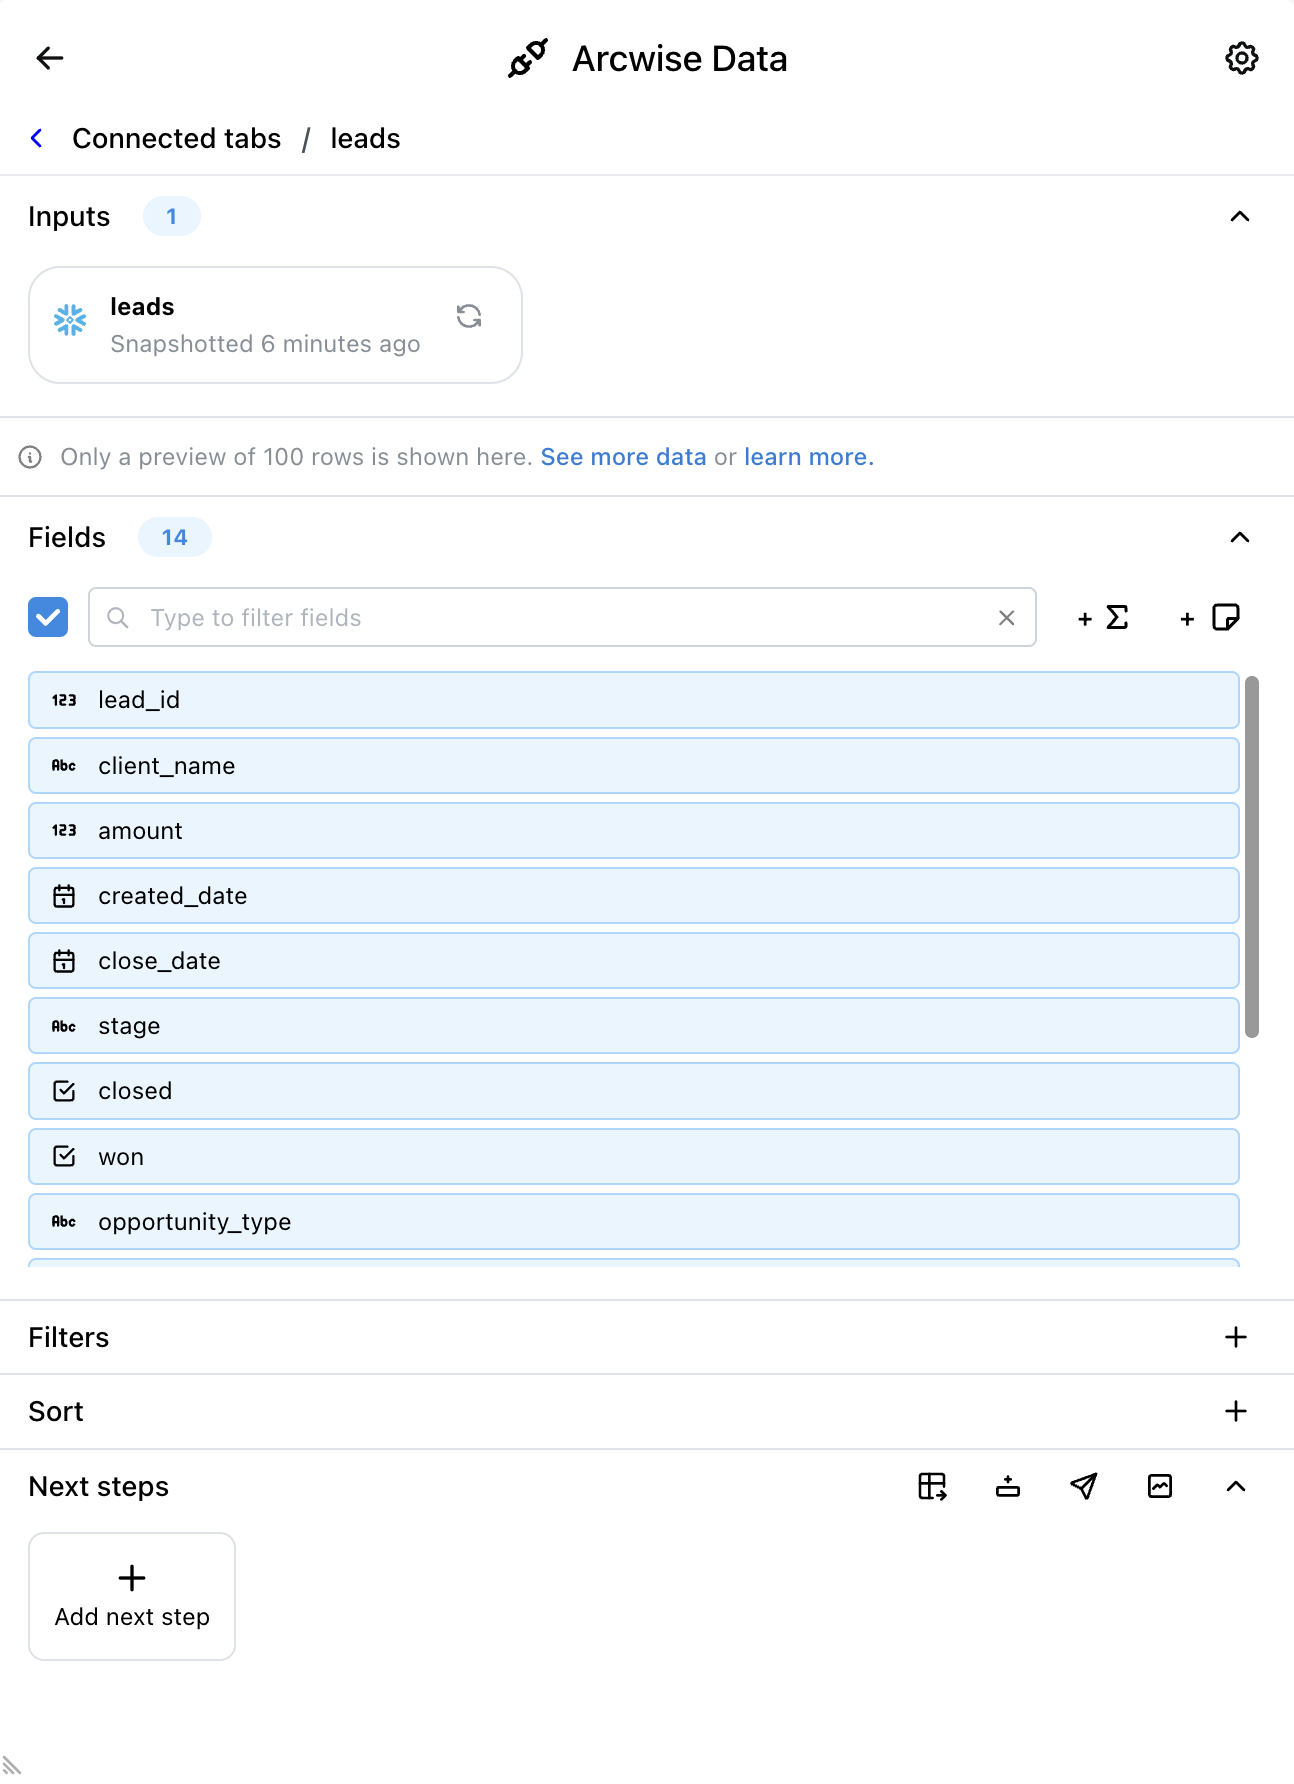
3\) Select the Arcwise connected data tab you would like to modify.

<figure><img src="/files/f4KcNabvxOp1dZkBgQEP" alt="" width="375"><figcaption></figcaption></figure>
{% endtab %}
{% endtabs %}


# Adding Columns

You can add an arbitrary number of additional columns to any Arcwise connected data tab. These columns are defined using spreadsheet formulas that are identical to the formulas in Google Sheets. To filter data navigate to the Arcwise connected data interface [Arcwise Connected Data](/using-arcwise-in-sheets/arcwise-connected-data).

{% hint style="info" %}
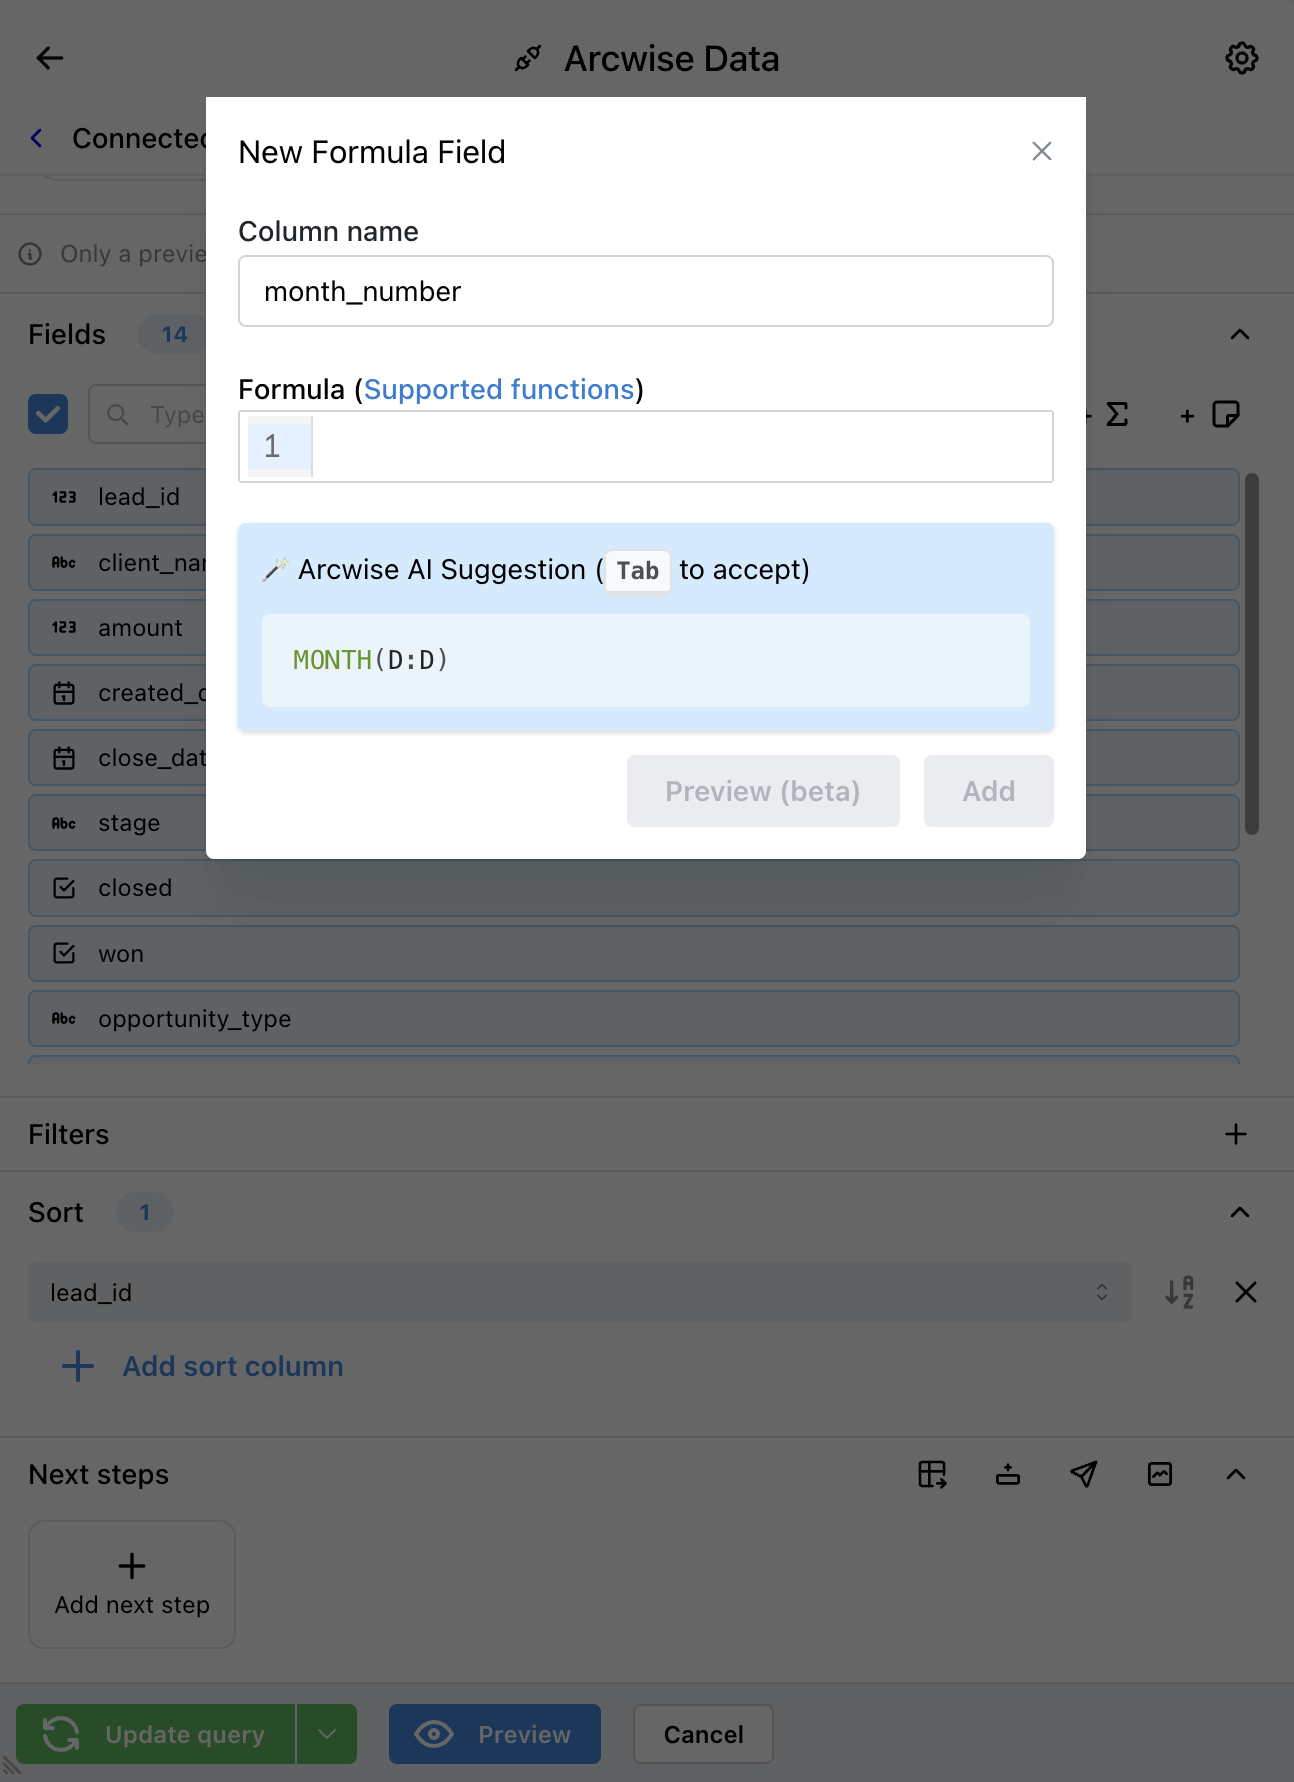
Arcwise provides AI suggestions for column formulas. If you give your column a meaningful name (EG: month\_number) then Arcwise will typically provide a suggestion that computes the value you need.
{% endhint %}

Arcwise supports most formulas. To see a complete list see: [Supported Formulas](/using-arcwise-in-sheets/supported-formulas)

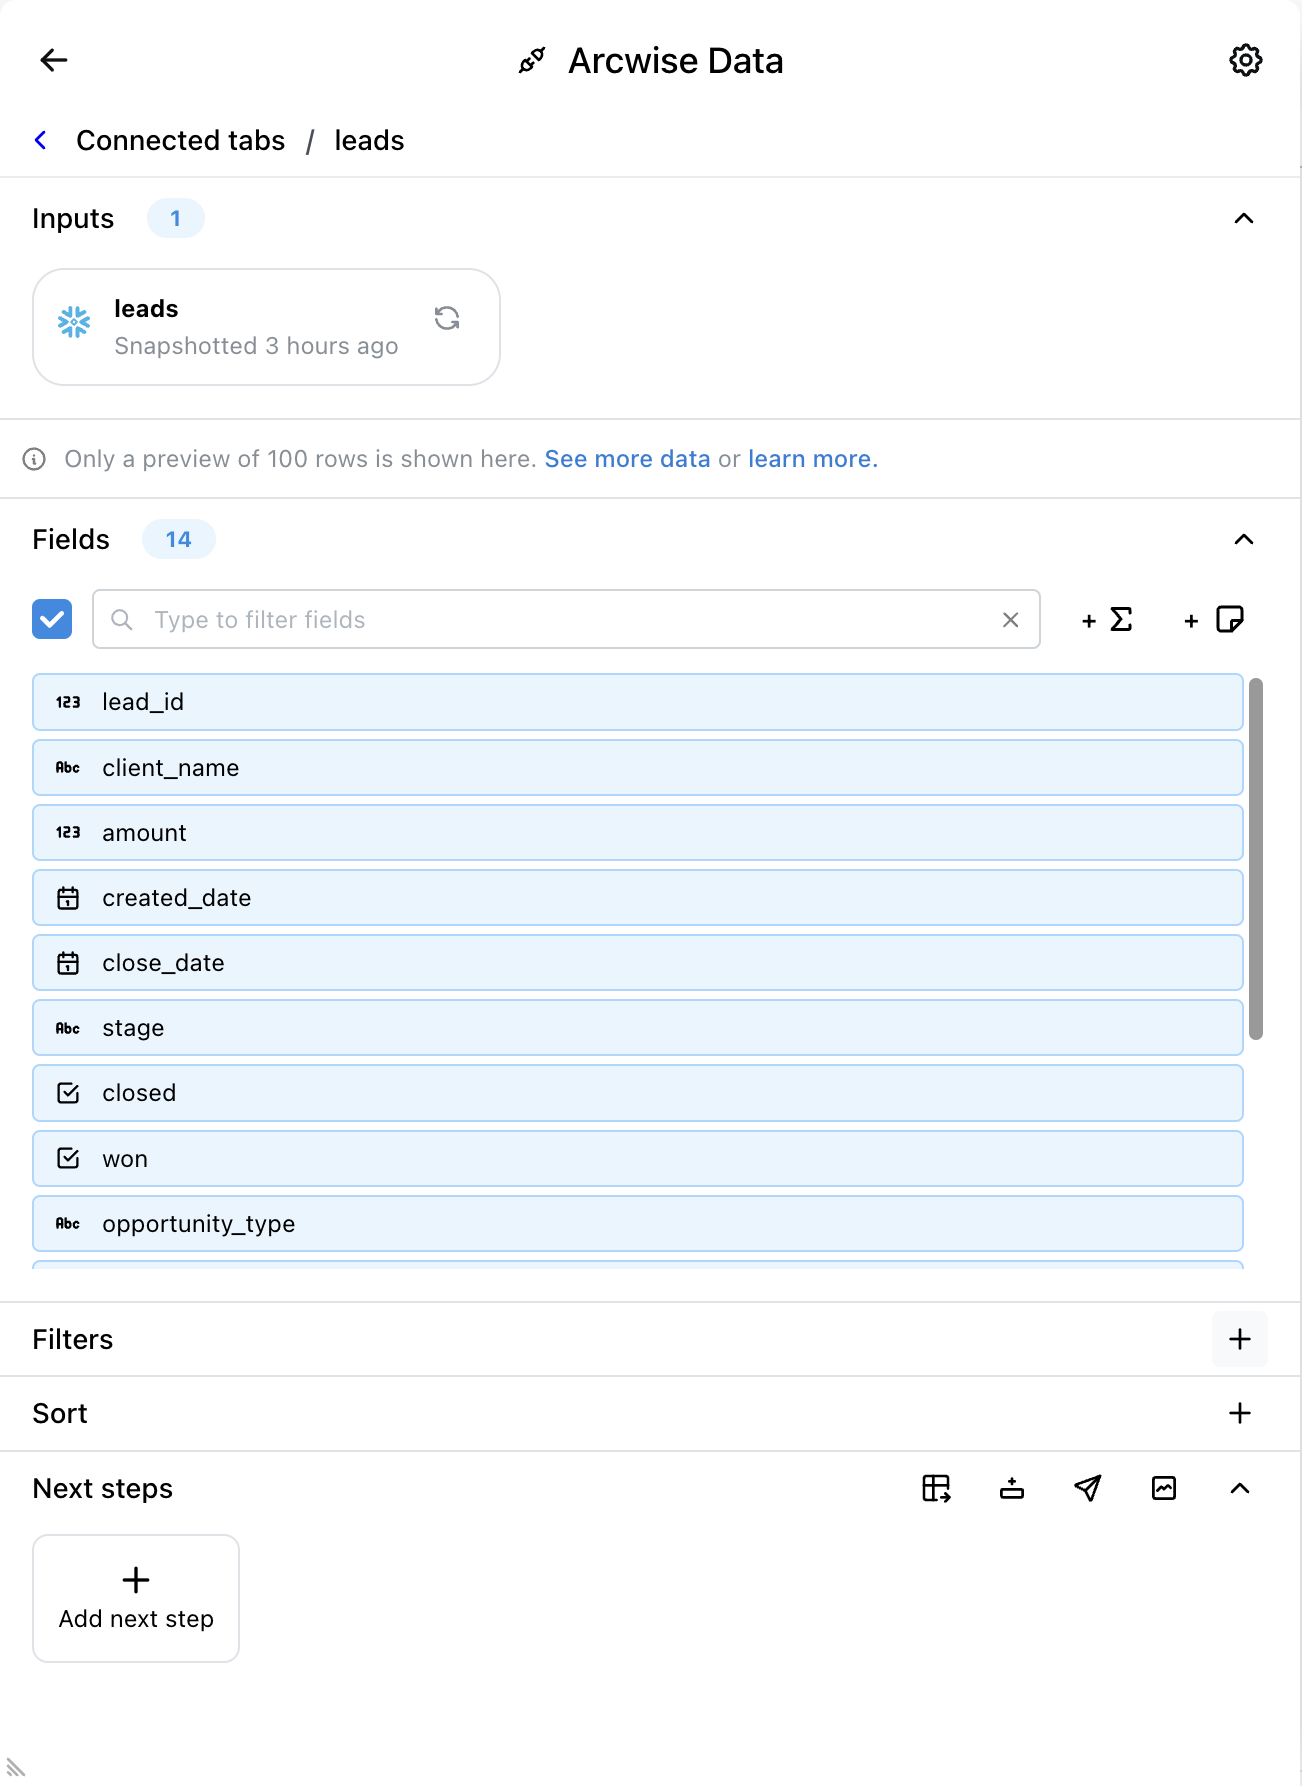
1\) Click on the formula button (**Σ**) in the **Fields** section.

<figure><img src="/files/X1CmwujCK6Ck03jr4hq2" alt="" width="375"><figcaption></figcaption></figure>

2\) Give your column a meaningful name. Spaces, quotes, and special characters are not allowed.

<figure><img src="/files/xpy0FeAhGQ5dvjBXIp51" alt="" width="375"><figcaption></figcaption></figure>

3\) Arcwise AI will give a suggestion in the blue box. If this suggestion appears correct you can accept it by clicking the **Formula** box and hitting Tab. If the suggestion is not correct you can enter your own formula to define the new column.

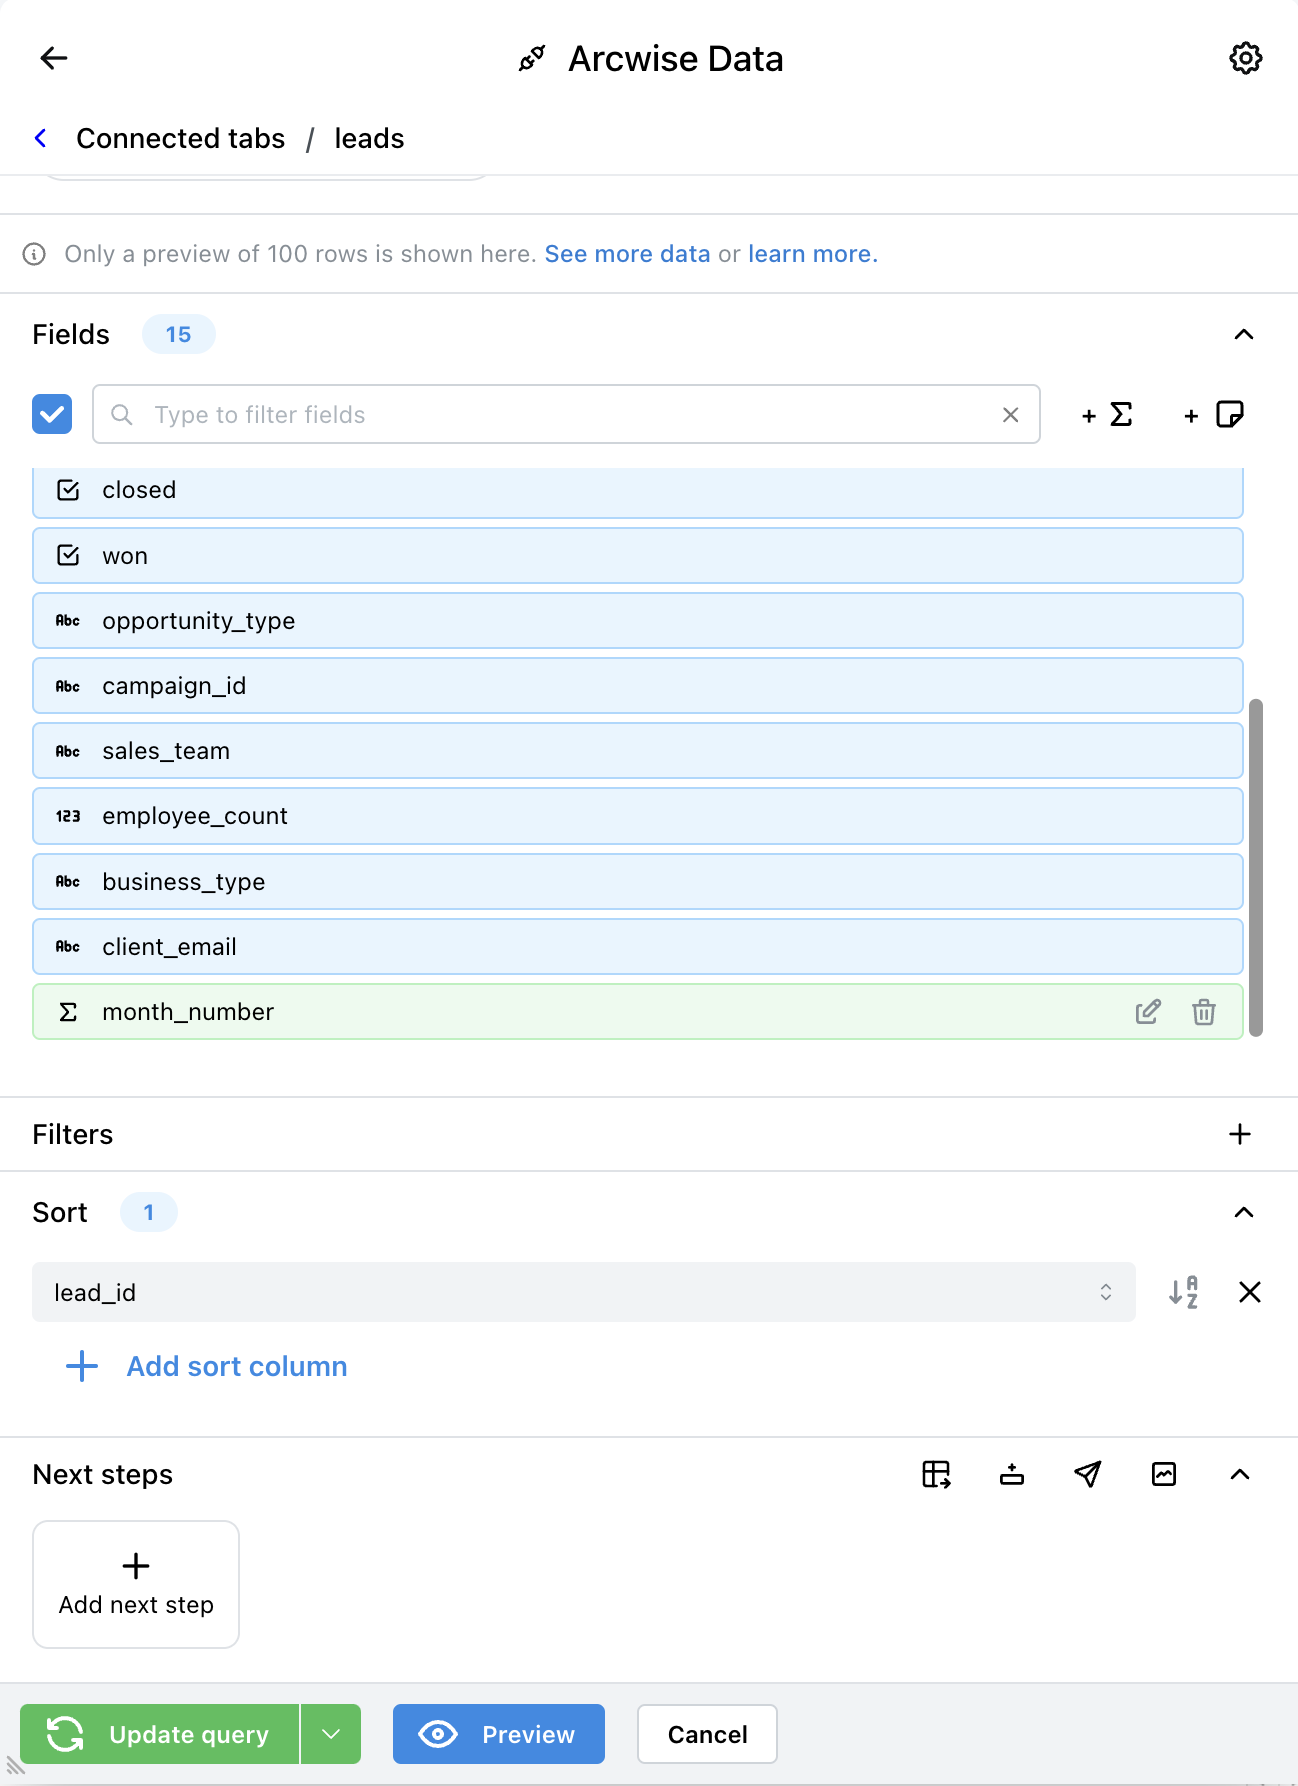
4\) After adding the column you will see a new field with your column name in green. You can edit or delete this column later. Click the green **Update query** button in the bottom left corner to add your new column to the data.

<figure><img src="/files/eN4Jw3M3yBWlSS3GxDRZ" alt="" width="375"><figcaption></figcaption></figure>


# Filtering

You can add an arbitrary number of filters to any Arcwise connected data tab. To filter data navigate to the Arcwise connected data interface [Arcwise Connected Data](/using-arcwise-in-sheets/arcwise-connected-data).

1\) Click on the plus button in the **Filters** section.

<figure><img src="/files/X1CmwujCK6Ck03jr4hq2" alt="" width="375"><figcaption></figcaption></figure>

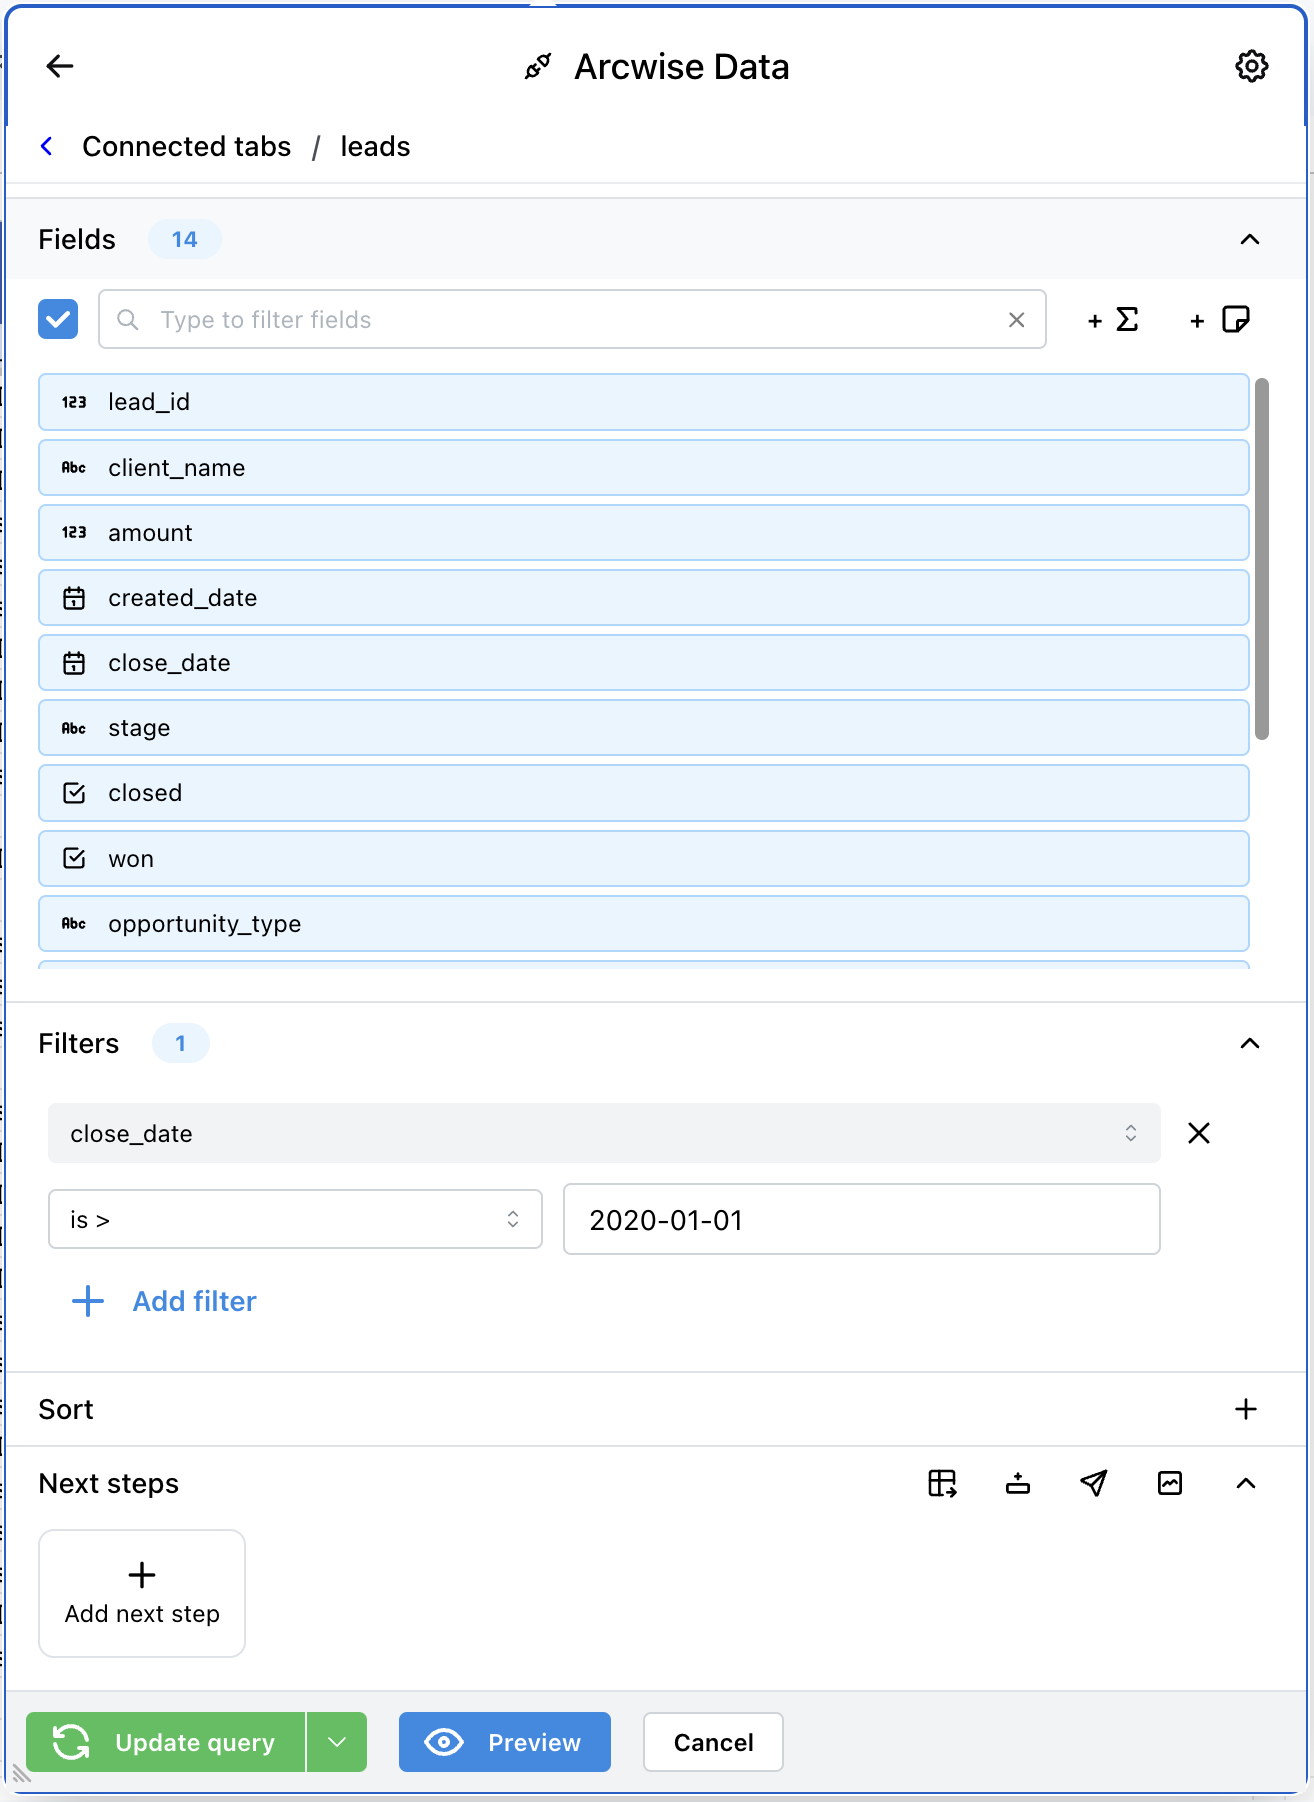
2\) Select the column you would like to filter, the type of comparison you would like to add, and the values you would like to include in the filter. For multiple values press enter after entering each value. Values must be exact and are not validated against the data.

<figure><img src="/files/tCYEMmklUZ3rVgP6gXd2" alt="" width="375"><figcaption></figcaption></figure>

3\) Click the green **Update query** button in the bottom left corner to apply your filter.


# Sorting

You can sort the data in any Arcwise connected data tab. You can sort on several columns, where earlier columns take precedence in the ordering. To sort data navigate to the Arcwise connected data interface [Arcwise Connected Data](/using-arcwise-in-sheets/arcwise-connected-data).

1\) Click on the plus button in the **Sort** section.

<figure><img src="/files/X1CmwujCK6Ck03jr4hq2" alt="" width="375"><figcaption></figcaption></figure>

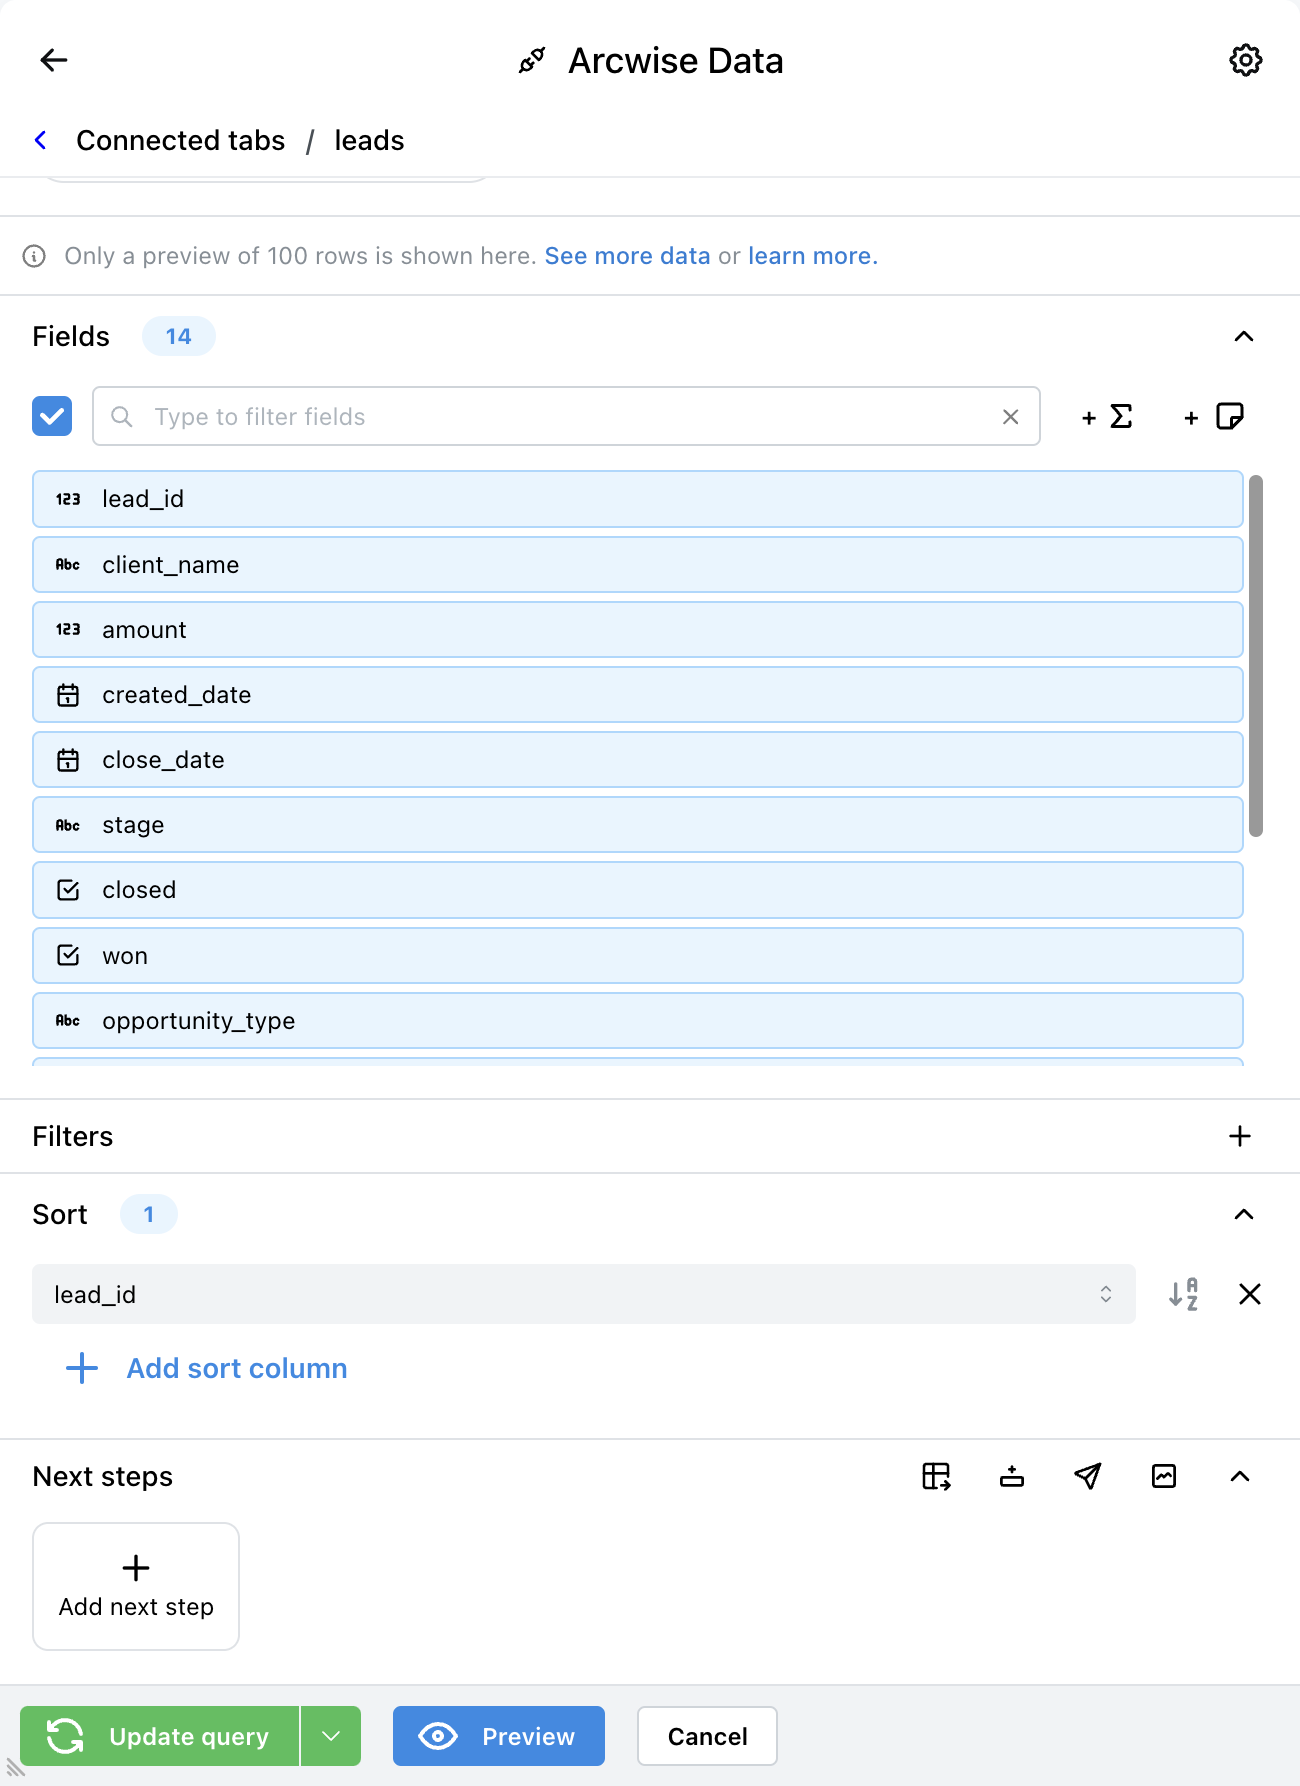
2\) Select the column you would like to sort on. If you would like to sort on multiple columns click the **Add sort column**. You can add as many columns as you like here though performance will decrease with many sorts on large data sets (>100,000 rows).

<figure><img src="/files/h8m0vFa0z7kqwpHYAEOt" alt="" width="375"><figcaption></figcaption></figure>

3\) Click the green **Update query** button in the bottom left corner to apply your sorting.


# Working With Large Data

Arcwise connected data tabs can have millions, or even billions, of rows. If you went through the process in [Connecting data](/connecting-data/connecting-data) and the result had more than 200,000 cells then **your Arcwise connected data tab will only display 100 rows**. This data is a preview.

You can work with large data in nearly the same way as normal data. You can use all the functionality available for Arcwise connected data tabs. See [Overview](/arcwise-setup/integrations/overview).

{% content-ref url="/pages/4MhQxTzyKlRbRAcB4q71" %}
[Adding Columns](/using-arcwise-in-sheets/arcwise-connected-data/adding-columns)
{% endcontent-ref %}

{% content-ref url="/pages/3SeHnU1cK8FnIjrpBYA2" %}
[Filtering](/using-arcwise-in-sheets/arcwise-connected-data/filtering)
{% endcontent-ref %}

{% content-ref url="/pages/oVn4IxVynBRvtOhNB3t3" %}
[Sorting](/using-arcwise-in-sheets/arcwise-connected-data/sorting)
{% endcontent-ref %}

{% content-ref url="/pages/T67I8XOJ4viF4Fqykr81" %}
[Pivot Tables](/using-arcwise-in-sheets/pivot-tables)
{% endcontent-ref %}

{% content-ref url="/pages/qq49bpFdPmAWobFw4QrR" %}
[Creating Manual Visualizations](/using-arcwise-in-sheets/creating-manual-visualizations)
{% endcontent-ref %}

## Suggestions for working with large data

{% hint style="info" %}
The easiest way to work with large Arcwise data is to use the AI analyst. The AI analyst works especially well when your data is large.
{% endhint %}

When working with large data you can only see a 100 row preview in the sheet. It is useful to add sorting and filters to observe different values of the data. Additionally, you can apply pivot tables to aggregate the data and make it small enough to fit within a standard spreadsheet tab.


# Using Formulas in Sheets

### Writing Arcwise formulas

Spreadsheet formulas that reference Arcwise tables will automatically execute on the full dataset in the database. If you reference a column from an Arcwise sheet tab, you should see an Arcwise icon appear in the formula bar:

<figure><img src="/files/4VjEc091jdRPbmtNPcE4" alt="" width="335"><figcaption></figcaption></figure>

Arcwise formulas run in your database; you should see a brief "Loading" message while the formula executes and the final value appears.

{% hint style="info" %}
Arcwise connected data tabs will only display a preview of 100 rows if the data is very large. Formulas on Arcwise connected data tabs will run on **the entire data set** regardless of whether just a preview shows in the sheet.
{% endhint %}

{% content-ref url="/pages/tM83Hk1ckIMZrqU1kxrt" %}
[Supported Formulas](/using-arcwise-in-sheets/supported-formulas)
{% endcontent-ref %}

### "Refreshing" Arcwise formulas

Unlike regular spreadsheet formulas, formulas that reference Arcwise data will not automatically re-calculate if their inputs change.

<figure><img src="/files/vCym9R2siZ6nrUwjQWIt" alt=""><figcaption></figcaption></figure>

When a cell needs to be refreshed, it will change to a light blue background and its value will appear as `#N/A`. You can refresh these formulas with the inline refresh button shown (keyboard shortcut: **Cmd + E** on MacOS or **Alt + E** on Windows. "E" is for "Execute"!)

{% hint style="info" %}
You may also see `#N/A` values when copy/pasting or autofilling Arcwise formulas to other cells. Refreshing the cells will populate these cells with real values.
{% endhint %}

You can also refresh cells using the Chrome extension. First click on the formula button in the top right corner.

<figure><img src="/files/rqr5DQQLLyZlB7uUPP84" alt="" width="375"><figcaption></figcaption></figure>

Then select the appropriate button to refresh the formulas you are interested in.

<figure><img src="/files/xJQXH4ZQpbeCt3ZlKTn5" alt="" width="375"><figcaption></figcaption></figure>


# Supported Formulas

Arcwise allows you to use almost all formulas on arbitrarily large data. Formulas can be used directly on Arcwise connected data: [Adding Columns](/using-arcwise-in-sheets/arcwise-connected-data/adding-columns). Formulas can also be used in your Google Sheet.

{% hint style="info" %}
To refer to other columns in formulas you can either use the name of the column (e.g. `ship_date`) or spreadsheet-style `A:A`, `B:B` notation. Clicking on columns while the formula editor is open will automatically insert a reference to the column in the editor.
{% endhint %}

Examples formulas:

* `MONTH(created_date)` will extract the month from a date column
* `MID(name, FIND(" ", name), LEN(name))` would extract the last name from a string column containing full names (e.g. "Firstname Lastname")

## Column Formulas and Operators

A limited subset of spreadsheet functions are supported in formula fields. These will be automatically translated to their SQL equivalent. Standard arithmetic operators are also supported (+, -, /, \*, ^).

**Logical functions**

* `AND(x, y)`
* `IF(logical_expression, value_if_true, value_if_false)`
* `IFNA(value, value_if_na)`
  * NOTE: this actually checks against `NULL` values in the database
  * **Warning: IFERROR is not currently supported. For the common 'catching division by zero errors' use case, you can instead use:** `DIV0(a, b)` in Snowflake and `SAFE_DIVIDE(a, b)` in BigQuery, which will result in a NULL (empty) value instead of an error.
* `NOT(x)`
* `OR(x, y)`

**String functions**

* `DATEVALUE(string)`
* `FIND(needle, haystack, [starting_position = 1])`
* `LEFT(string, number_of_characters)`
* `LEN(string)`
* `LOWER(string)`
* `INT(string)`
  * Converts a string to an integer (rounding to the nearest integer)
* `MID(string, starting_at, extract_length)`
* `REGEXEXTRACT(text, regular_expression)`
  * NOTE: The REGEXEXTRACT function of Google Sheets will populate multiplle columns with multiple match groups. Our implementation will always return the entire matching part of the subject. Different warehouse types (Snowflake, Bigquery, PostgreSQL) have each their own implementations of REGEX. When writing REGEX, expect the specific behavior from the warehouse that your data is connected to, as we execute your REGEX without any processing on that data warehouse.&#x20;
* `RIGHT(string, number_of_characters)`
* `TRIM(string)`
* `UPPER(string)`
* String concatenation - both `&` and `CONCATENATE(string1, [string2, ...])`

**Numerical functions**

* `INT(value)`
* `MAX(value1, [value2, ...])`
* `MIN(value1, [value2, ...])`
* `RAND()`
* `RANDBETWEEN(low, high)`
* `ROUND(value, [places])`
* `ROUNDDOWN(value, [places])`
* `ROUNDUP(value, [places])`
* `VALUE(val)`
  * Converts a value (typically a string) into a numeric value.
* **Standard math functions:** ABS, ACOS, ASIN, ATAN, COS, COT, DEGREES, EXP, FLOOR, LN, LOG, LOG10, MOD, PI, POWER, RADIANS, SIGN, SIN, SQRT, TAN

**Date functions**

* `DATEDIF(date1, date2)`
* `DATEVALUE(string)`
* `DAY(date)`
* `EOMONTH(date)`
* `EDATE(date, number_of_months)`
* `MONTH(date)`
* `WEEKDAY(date)`
* `WEEKNUM(date)`
* `YEAR(date)`

#### Advanced usage: Rolling/window functions

It may be helpful to skip straight to the examples (see below.)

* `ROLLINGSUM(value)`
  * Calculates the rolling sum of a value or column (requires a sort order to be added in the tab as well.)
* `ROLLINGSUMBY(value, group_column1, [group_column2, ...])`
  * Calculates the rolling sum of a column over all rows with the same group\_column1, group\_column2, etc.
* `ROLLINGMIN(value)` & `ROLLINGMINBY(value, group...)`
  * Calcululates the rolling **min** of a column (same syntax as above)
* `ROLLINGMAX(value)` & `ROLLINGMAXBY(value, group, ...)`
  * Calcululates the rolling **max** of a column (same syntax as above)
* `FILLDOWN(value)` & `FILLDOWNBY(value, group, ...)`
  * "Fills down" non-empty / non-NULL values in a column downwards. In other words, if the `value` argument is currently NULL or empty, then we will instead take the previous non-empty value of the same grouping (if one exists.)

We also have "non-rolling" versions of min/max/sum (`MINBY`, `MAXBY`, `SUMBY`) which calculate the overall min/max/sum over all rows within the same group.

**Examples**

This example table shows the result of various different "rolling calculations" using hypothetical `value` and `group` columns. (assuming that the table is already in sorted order.)

Providing a `group` basically means that all the rows within a certain group (e.g. group "a" or group "b") will have their rolling values calculated independently. You can provide multiple `group` columns to refine the grouping even further.

<table data-full-width="true"><thead><tr><th>value</th><th>group</th><th data-type="number">ROLLINGSUM(value)</th><th>ROLLINGMINBY(value, group)</th><th>FILLDOWNBY(value, group)</th><th data-type="number">SUMBY(value, group)</th></tr></thead><tbody><tr><td>1</td><td>a</td><td>1</td><td>1</td><td>1</td><td>3</td></tr><tr><td>(empty)</td><td>a</td><td>1</td><td>1</td><td>1</td><td>3</td></tr><tr><td>2</td><td>a</td><td>3</td><td>1</td><td>2</td><td>3</td></tr><tr><td>(empty)</td><td>b</td><td>3</td><td>(empty)</td><td>(empty)</td><td>4</td></tr><tr><td>4</td><td>b</td><td>7</td><td>4</td><td>4</td><td>4</td></tr><tr><td>(empty)</td><td>b</td><td>7</td><td>4</td><td>4</td><td>4</td></tr></tbody></table>

If `value` is in column A and `group` is in column B, here are the equivalent Google Sheets formulas:

(Assuming C2, D2, E2, F2 all start at $A2)

* `ROLLINGSUM(value)`
  * `C3 = $C2 + $A3` (drag down)
* `SUMBY(value, group)`
  * `D3 = SUMIF($B2:$B, $B3, $A2:$A)`
* `ROLLINGMINBY(value, group)`
  * `E3 = IF($B3=$B2, MIN($E3, $E2), $E3)` (drag down)
* `FILLDOWNBY(value, group)`
  * `F3 = IF($B3=$B2, IF($F3<>"", $F3, $F2), $F3)` (drag down)

#### Advanced usage: SQL functions

Though not officially documented, most SQL functions will work inside Arcwise formula fields. Consult the official docs for your warehouse.

Helpful functions that generally work across databases (WARNING: these often are DIFFERENT from the Google Sheets functions of the same name.)

* `REPLACE(source_string, search_string, replace_string)`
  * Example: `REPLACE("the quick fox", "quick", "slow")`&#x20;
* `REGEXP_REPLACE(subject, pattern, replacement)`
  * <https://docs.snowflake.com/en/sql-reference/functions/regexp_replace>
* `REGEXP_SUBSTR(subject, pattern[, position[, occurrence]])`
  * <https://docs.snowflake.com/en/sql-reference/functions/regexp_substr>

**Links to references:**

* Snowflake functions: <https://docs.snowflake.com/en/sql-reference/intro-summary-operators-functions>
* BigQuery functions: <https://cloud.google.com/bigquery/docs/reference/standard-sql/functions-and-operators>

## Aggregation Formulas

{% hint style="info" %}
Aggregation formulas can not be used to create new columns in Arcwise connected data tabs: [Adding Columns](/using-arcwise-in-sheets/arcwise-connected-data/adding-columns). They are exclusivly used within Google Sheets: [Using Formulas in Sheets](/using-arcwise-in-sheets/formulas).
{% endhint %}

* `COUNT` / `COUNTIF` / `COUNTIFS`
* `COUNTUNIQUE / COUNTUNIQUEIFS`
* `SUM` / `SUMIF` / `SUMIFS`
* `AVERAGE` / `AVERAGEIF` / `AVERAGEIFS`
* `MIN` / `MINA` / `MINIFS`
* `MAX` / `MAXA` / `MAXIFS`
* `MEDIAN` / `MODE`
* `COUNTA` / `ROWS`
  * NOTE: Regardless of the column passed in, these will always return the full number of rows in the connected dataset.
* `LOOKUP` / `XLOOKUP`
  * Both LOOKUP & XLOOKUP are the same with Arcwise (and do not require "sorted data"). However, if there are multiple matches, one of the matches will be randomly selected.
  * Note: only the first three arguments (search\_key, lookup\_range, result\_range) are supported at the moment.
* `ARCFILTERIFS`
  * A cross between the Sheets `FILTER` and an `IFS` function (will return all matching rows in the table, but takes pairs of criteria like COUNTIFS/SUMIFS.)
* `ARCUNIQUE`
  * Returns all unique values in a column.
* `ARCQUERY`
  * Executes inline SQL. See the section below on [#arcquery](#arcquery "mention").

NOTE: Numeric aggregations like SUM, AVERAGE, MIN, MAX, etc. will not work with string columns at the moment.

### Notes on criteria functions (\*IF / \*IFS)

* For columns that are not strings in the database, we interpret the empty string criteria `""` to count the number of `NULL` values. Conversely, `"<>"` will count the number of non-null values.
  * Example: `=COUNTIF(ARCTable!A:A, "")` will count the number of `NULL` values in column A.
* Date columns can be compared against `YYYY/MM/DD, MM/DD/YYYY, YYYY-MM-DD, MM-DD-YYYY` criteria (or numeric spreadsheet dates like `44322`). Other formats may not work as expected.

### ARCQUERY

We expose a special formula, `ARCQUERY`, to allow inline SQL queries in a spreadsheet cell. Syntactically, the first argument(s) should be columns from Arcwise tables, and the second argument should be a SQL query. In the SQL query, use the **lowercase** source sheet name to reference the source Arcwise table. Example:

```cpp
=ARCQUERY(ArcTable!$A:$A, "SELECT * FROM arctable LIMIT 10")
```

You can pass in columns from multiple Arcwise sheets and query them all at once:

```cpp
=ARCQUERY(ArcTable!$A:$A, Sheet2!$B:$B, "SELECT * FROM arctable JOIN sheet2
 ON arctable.id = sheet2.id")
```

> Note: Sheets with spaces or other non-alphanumeric characters may need to be quoted. Usually this means the table name will be e.g. `"sheet 1"` (if you're on BigQuery, then use backticks: `` `sheet 1` ``). Note that double-quotes need to be escaped with **two** double-quotes:
>
> `=ARCQUERY('Sheet 1'!$A:$A, "SELECT * FROM ""sheet 1""")`

### Known limitations

When using Arcwise columns, the following functions are currently unsupported (as of July 2023). Please contact us if you have a use case that requires these!

* `ARRAYFORMULA` (and using array literals like `{1,2,3}` in general)
* `ROW` / `COLUMN` / `INDIRECT`
* `LET` / `LAMBDA`


# Pivot Tables

Arcwise supports pivots on data tabs. To create a pivot follow the steps below.

1\) Navigate to the [Arcwise Connected Data](/using-arcwise-in-sheets/arcwise-connected-data) tab you would like to do a pivot on.

<figure><img src="/files/PI7OFwvs7YN62G8jF9rL" alt="" width="375"><figcaption></figcaption></figure>

2\) From the **Add next step** menu at the bottom left corner select **Add pivot transform**.

<figure><img src="/files/nP9tv4ttteRRVeIcDQNp" alt="" width="375"><figcaption></figcaption></figure>

3\) Add the filters, columns, rows, and value you want in the pivot and **Preview** the result

<figure><img src="/files/SCkhxXslOMnCxfmDsCvv" alt=""><figcaption></figcaption></figure>

4\) When the result looks correct click the green Connect button in the bottom right corner.

### Supported Formulas and Aggregations

Similar to column-level formulas, for pivots we support a subset of the built-in Sheets functions and most common arithmetic expressions. You can also use SQL functions.

#### List of officially supported functions

* **Aggregation functions**
  * SUM
  * COUNT, COUNTUNIQUE
  * AVERAGE
  * MIN, MAX
  * MEDIAN, MODE
  * STDEV, STDEVP
  * VAR, VARP
  * CORREL
  * COVAR, COVARIANCE.P
* **Math functions:** ACOS ASIN ATAN COS COT DEGREES EXP FLOOR LEFT LEN LN LOG LOG10 LOWER MOD PI POWER RADIANS REGEXEXTRACT RIGHT SIGN SIN SQRT TAN TRIM UPPER

#### Examples

* Assuming your table has `cost` and `quantity` columns, the formula `SUM(cost) / SUM(quantity)` would yield the average cost per item.
* Or if you have a table of orders with `price` and `quantity`, `AVERAGE(price * quantity)` would give you the average size of the orders.


# Creating Manual Visualizations

{% hint style="warning" %}
Visualizations can only be created from a table with the proper structure. Often this means that a visualization cannot be created on raw data. Typically [Pivot Tables](/using-arcwise-in-sheets/pivot-tables) are required to prepare the data for visualization.
{% endhint %}

To create a visualization use the following steps.

1\) In an Arcwise connected data tab with an appropriate structure navigate to the Arcwise connected data tab view: [Arcwise Connected Data](/using-arcwise-in-sheets/arcwise-connected-data).

<figure><img src="/files/HEvhwPxxyfZGpeB8mU3L" alt="" width="375"><figcaption></figcaption></figure>

2\) At the top of the **Next steps** section click the visualization icon and select **Arcwise visualization**.

<figure><img src="/files/NNFubWhirEyffXNdEiZo" alt="" width="375"><figcaption></figcaption></figure>

3\) Configure the visualization how you would like using the interface.

<figure><img src="/files/I1TgI9T36OFJinHKP83w" alt=""><figcaption></figcaption></figure>

4\) Click the green **Save** button on the bottom right to save the visualization to your sheet.


# AI Analyst Overview

Arcwise AI analyst can be used for a wide range of tasks: data retrieval, creating business metrics,  creating visualizations, and generating insights that can be copied to reports.

We offer three main interfaces to interact with the Arcwise AI Analyst

* Via the Arcwise Chrome Extension [in Sheets](/using-arcwise-ai-analyst/using-ai-analyst-in-sheets).
* A standalone webapp: <https://sql.arcwise.app>
* An [embeddable chat window](/using-arcwise-ai-analyst/embedding-the-ai-analyst-chat)


# Using AI Analyst in Sheets

Arcwise AI analyst can be accessed via our Chrome Extension within Sheets. You can see example prompts and usage in the below sections.

{% content-ref url="/pages/pb5PTYOmLS1gD8eLKCHo" %}
[Getting Data Using AI](/using-arcwise-ai-analyst/getting-data-using-ai)
{% endcontent-ref %}

{% content-ref url="/pages/VkQi1iZJZWmeTfXGaJ06" %}
[Creating a Visual](/using-arcwise-ai-analyst/creating-a-visual)
{% endcontent-ref %}

{% content-ref url="/pages/6sRDxNrddGG2GcAjC6LY" %}
[Generating an Insight](/using-arcwise-ai-analyst/generating-an-insight)
{% endcontent-ref %}

Arcwise AI analyst can work on any data connected to Arcwise. This includes:

* Data from your data warehouse (this does NOT need to be imported into the sheet)
* CSVs imported as Arcwise connected data tabs (preferred method of import)
* Data from your connected tools (EG: Salesforce, NetSuite)
* Reports and views from your connected tools imported as Arcwise connected data tabs

Arcwise AI analyst can also operate on data in your spreadsheet that is not an Arcwise connected data tab.

{% content-ref url="/pages/U0uo6OAsjgQ2KgAoUqdV" %}
[Using AI Analyst on Spreadsheet Data](/using-arcwise-ai-analyst/using-ai-analyst-on-spreadsheet-data)
{% endcontent-ref %}

{% hint style="warning" %}
Arcwise AI is most effective on Arcwise connected data. If you have data in your spreadsheet it is preferred to connect it as an Arcwise connected data tab. This can be done manually for all sources, including CSVs: [Connecting Data](/connecting-data/connecting-data).

If your data originated in a data warehouse the easiest way to get the data is with AI: [Getting Data Using AI](/using-arcwise-ai-analyst/getting-data-using-ai). This automatically creates an Arcwise connected data tab.
{% endhint %}


# Getting Data Using AI

There are several ways Arcwise AI can be used to retrieve data. Below are some example prompts as well as instructions for saving it to the sheet.

## Example Prompts

> Get me a table of all transactions last year

This prompt can be executed from a blank sheet and will recover a table of transactions from your data warehouse, or other connected data source. This could be **millions of rows** but you will still be able to save it to the sheet and work with the data, both with normal spreadsheet tools and with AI: [Working With Large Data](/using-arcwise-in-sheets/working-with-large-data).

> Get me a list of our stores, the total sales at those stores last year, and the YoY change in sales&#x20;

This prompt can be executed from a blank sheet and will recover a table of transactions from your data warehouse, or other connected data source. It can also be executed after manually connecting the correct data source: [Connecting Data](/connecting-data/connecting-data). This data is likely to be small.

{% hint style="warning" %}
If Arcwise is connected to your data warehouse then you can retrieve tables from an empty sheet. If Arcwise is not connected to your data warehouse, or your administrator has not given the AI access to the data warehouse then you must add tables using the traditional flows: [Connecting data](/connecting-data/connecting-data).
{% endhint %}

## Saving Data to the Sheet

After asking the AI analyst for data you can save it to the sheet with the **Save** button.

<figure><img src="/files/bcbzXGHoevuaFQNfsaAk" alt="" width="375"><figcaption></figcaption></figure>


# Creating a Visual

Arcwise AI analyst has the ability to create visuals. In the process of creating a visual it will produce a query that collects data and then visualize the resulting data.

## Example Prompts

> Show me leads over time by month and lead source

This prompt can be executed from a blank sheet or a sheet with some tab named **leads**. It will recover a table with month, lead source, and the count of leads. Then it will produce a visualization of this data.

## Saving Visuals to the Sheet

After a visual is created it can be saved to the sheet with the blue **Save** button. It can also be edited prior to saving to the sheet using the **Edit** button. The visualization can be re-edited once it is in the sheet.

<figure><img src="/files/u9zdzBfVlY2GPlHrLTYr" alt="" width="375"><figcaption></figcaption></figure>


# Generating an Insight

Arcwise AI analyst is uniquely design to generate data based insights. Insights can help answer questions like:

* Why was there a sales spike in July?
* Why were shipments delayed yesterday?
* What factors led to the increase in inbound last week?

Arcwise can help do the analysis so that the user can get answers. Arcwise doesn't have all of the business context and can't draw conclusions but it can search the data it has access to for possible causes.

{% hint style="warning" %}
Arcwise is best able to generate insights after information has been added to the AI context. Without business specific context the AI will be less focused and may not have the proper information to get to a root cause analysis.
{% endhint %}

{% hint style="warning" %}
Arcwise can only leverage data is has access to. This may or may not include data in your data warehouse. Ask your administrator what Arcwise has access to.

To ensure Arcwise has access to some specific piece of data you can always connect it to the sheet: [Connecting data](/connecting-data/connecting-data).
{% endhint %}

## Case Study

We start with a data set from Salesforce that contains all of our deals. We want to track the total value of closed deals over time. We can get this information from the AI analyst.

> show me total deal size over time by month for 2022

<figure><img src="/files/3Gc9Rkplj9wAoI1rFW6D" alt="" width="375"><figcaption></figcaption></figure>

We see there is a very large spike in July and now we would like to know why. This is where we need to generate some kind of ***insight*** about what happened in July. We can ask for some insight.

> explain the spike in july

This will prompt the AI to look for relevant data that could lead to an explanation. In this case it looks at 4 related metrics to help explain the situation, visualizes those metrics, and provides a text summary of the data.

<figure><img src="/files/AMmlKB05omeWQVqOmB2q" alt="" width="375"><figcaption><p>Deal sizes were much larger for Direct Traffic</p></figcaption></figure>

<figure><img src="/files/HLkFgXnW4nqOjuzwLwaK" alt="" width="375"><figcaption><p>A summary of findings</p></figcaption></figure>

From these results we can see that there was a much larger deal size for Direct Traffic and also that the average deal size was much higher. We can continue asking questions to further refine this insight.


# Using AI Analyst on Spreadsheet Data

Arcwise works best on Arcwise connected data tabs and data from your data warehouse: [Connecting data](/connecting-data/connecting-data). However Arcwise does work on normal spreadsheet data!

To work with Arcwise on spreadsheet data you can highlight the cells you are interested in analyzing. Arcwise will only work on data that is in a tabular form.

<figure><img src="/files/VBRAFQnAkMPERMbJCTgX" alt="" width="375"><figcaption></figcaption></figure>

You can start working with Arcwise on this range by click the small Arcwise icon in the top right of your selection

You can also open the Arcwise extension and select **Analyze the selected range.**

<figure><img src="/files/iqA6j4kCH7I88M6KU3Ei" alt="" width="375"><figcaption></figcaption></figure>

You can verify that Arcwise will work on this selection by checking the area **Focused on** at the top and verifying it references the range you selected. The initial thread name will also reference the selected cells, although the thread name can be modified later.

<figure><img src="/files/sRy44fOOStkAXobJhYlO" alt="" width="375"><figcaption></figcaption></figure>


# Embedding the AI Analyst Chat

The Arcwise AI Analyst can be embedded as an iframe within your page or application using our embeddable chat page, <https://sql.arcwise.app/chat-embed>, as the source.

Using this method, we allow the outer frame to pass parameters into the embeddable chat page using the following query parameters.

* `spreadsheet_id`

  If you have used the [Arcwise AI Analyst in Sheets](/using-arcwise-ai-analyst/using-ai-analyst-in-sheets), you may provide the Sheets spreadsheet id to chat across the connected tabs in that spreadsheet.
* `table`

  Instead of passing in a `spreadsheet_id`, you may provide fully-qualified table names in the form of `table=db.schema.table` to scope any new chat threads with the Arcwise AI Analyst to only those tables provided.  Multiple tables can be added to the AI Analyst context by providing this query parameter multiple times like so: `table=db.schema.table1&table=db.schema.table2&table=...`
* `custom_instructions`&#x20;

  This parameter may be used to provide any specific custom instructions to the Arcwise AI Analyst, which will be appended to its system context.

### JWT authentication

By default, the embedded AI Analyst chat will display a Google login button and ask the user to authenticate manually.

If you'd like to allow users to skip the login flow, the embedding URL may provide a user-specific JWT token via a `#token` hash parameter (example: `https://sql.arcwise.app/chat-embed?table=x#token=JWT_TOKEN`).

JWTs must be created programmatically in your embedding code through a server-side endpoint, to avoid leaking the **Embed Secret**.

1. Go to <https://admin.arcwise.app/#/organizations> and click to **Edit** your organization.  On the next screen, click **Manage Embed Secret**.
   1. Generate a new embed secret (**important:** you will only be shown this secret once, so you must store it securely in your application environment (e.g. as an environment variable) when it is created.
   2. Also, copy and store the **`organization_id`** in your application (this is non-sensitive).

<figure><img src="/files/lRwwUZv0UJ9FFoFWvWyH" alt=""><figcaption></figcaption></figure>

2. Generate a JWT with the following payload format using the **Embed Secret** as the JWT key, and the **Arcwise organization ID** as the issuer, using the HS256 encryption algorithm. **All fields in the payload are required.**

```javascript
// JWT JSON payload format
{
  "sub": "user@organization.com",
  "aud": "arcwise.app",
  "iat": [current UNIX time],
  "iss": [arcwise_organization_id],
  "exp": [desired expiration time, e.g. current time + 8 hours]
}
```

* `"sub"` should be the user's Google account email address. It must match the Google email they use to access Arcwise.
* `"aud"` specifies the *audience* for the JWT (Arcwise).
* `"iat"` should be the current UNIX timestamp.
* `"iss"` **must be** **your Arcwise Organization ID from above.**
* `"exp"` determines how long the JWT will be valid. The user will be logged out of the iframe after this time, so we recommend setting this to a fairly large number of hours (depending on your organization's security policy).

**Example with the** [**PyJWT**](https://pyjwt.readthedocs.io/en/stable/) **Python library**

```python
import jwt
import time

# Replace these with the values from the admin dashboard
arcwise_embed_secret = "00000000-0000-0000-0000-000000000000"
arcwise_organization_id = "12345678-1234-5678-4321-000000000000"
# viewer's email
user_email = "user@organization.com"
token_expiration_time = 8 * 3600  # 8 hours

# Generate a JWT
current_timestamp = int(time.time())
arcwise_token = jwt.encode({
    "sub": user_email,
    "aud": "arcwise.app",
    "iat": current_timestamp,
    "iss": arcwise_organization_id,
    "exp": current_timestamp + token_expiration_time,
}, arcwise_embed_secret, algorithm="HS256")

# Embedding URL
embed_url = f"https://sql.arcwise.app/chat-embed#token={arcwise_token}"
```


# GPT Formulas Overview

{% hint style="danger" %}
To follow these docs make sure you have our [Chrome Extension](https://chromewebstore.google.com/detail/ai-copilot-for-sheets-by/icpldamjhggegoohndlphlchjgjkdifd?hl=en\&utm_source=arcwise_docs) installed.
{% endhint %}

{% hint style="info" %}
We highly recommend copying our public template and following the instructions there! [Arcwise - Public Template](https://docs.google.com/spreadsheets/d/15QAnr4uISOVpHHkfT8z1B_d2IOdUaw3r-eeP33da-JA/copy?usp=sharing)
{% endhint %}

{% embed url="<https://youtu.be/1KF27r8_QV0>" %}
Video: Using GPT formulas to analyze hundreds of movie reviews in seconds
{% endembed %}

### Follow the steps below to start using GPT formulas

1\) Install our free [Chrome extension](https://chromewebstore.google.com/detail/ai-copilot-for-sheets-by/icpldamjhggegoohndlphlchjgjkdifd?hl=en) from the Chrome Web Store:

<figure><img src="/files/ICRc3pldwAZfw9SeLD25" alt=""><figcaption><p><a href="https://chromewebstore.google.com/detail/ai-copilot-for-sheets-by/icpldamjhggegoohndlphlchjgjkdifd">Click "Add to Chrome"</a></p></figcaption></figure>

2\) Copy our public tutorial template: [Arcwise - Public Template](https://docs.google.com/spreadsheets/d/15QAnr4uISOVpHHkfT8z1B_d2IOdUaw3r-eeP33da-JA/copy?usp=sharing). This will create a copy of our template google sheet in your account that you can freely play with.

3\) Make sure that you have given Arcwise the proper permissions by clicking the icon in the top right corner of your sheet. You will be prompted to give Arcwise access to your sheets.

<figure><img src="/files/olG9D7iD6y7A6vIOEkuE" alt="" width="375"><figcaption><p>Click the Arcwise icon on the left side</p></figcaption></figure>

4\) You can now use any of the GPT functions by using the `$` symbol after starting a formula.

<figure><img src="/files/OUj5IfatRF7QuyjlMlp8" alt="" width="375"><figcaption><p>Type <code>=$</code> in any cell to get started!</p></figcaption></figure>

Continue to the links below to learn more about how these formulas work.

{% content-ref url="/pages/A6EiEyvQu6pR4JnimLVf" %}
[GPT Formula Basics](/using-arcwise-ai-formulas/gpt-formula-basics)
{% endcontent-ref %}

{% content-ref url="/pages/26tv9lw41zN1cg72oOvP" %}
[GPT Formula Reference](/using-arcwise-ai-formulas/gpt-formula-reference)
{% endcontent-ref %}


# GPT Formula Basics

{% hint style="danger" %}
Be sure you have properly set up Arcwise: [GPT Formulas Overview](/using-arcwise-ai-formulas/gpt-formulas-overview)
{% endhint %}

{% hint style="info" %}
We highly recommend copying our public template and following the instructions there! [Arcwise - Public Template](https://docs.google.com/spreadsheets/d/15QAnr4uISOVpHHkfT8z1B_d2IOdUaw3r-eeP33da-JA/copy?usp=sharing)
{% endhint %}

### Writing a GPT formula

To start writing a GPT formula use the `$` symbols directly after the `=` sign when starting a formula. You will see a drop down of available options.

<figure><img src="/files/eM49VuXjZE7MkXRHcp3J" alt="" width="375"><figcaption></figcaption></figure>

To complete the formula you can click a relevant cell that will be used as input or type an input.

<figure><img src="/files/udKtJxpc1ocNiMRI7N1l" alt="" width="563"><figcaption><p>All our AI functions take a cell/value as the first argument, and a description of what to do in the second argument.</p></figcaption></figure>

Applying a GPT formula to many rows or columns

You can apply a GPT formula to many values in exactly the same way as a normal Google Sheets formula. There are two methods:

{% tabs %}
{% tab title="Dragging formulas" %}
You can drag a formula from one cell across rows of columns:

<figure><img src="/files/6VuZlrLX0qhmxSQyqRgI" alt="" width="325"><figcaption></figcaption></figure>

When you do this you may see a block of `#N/A` values. This is indicating the the formula has not yet been computed. To compute the formulas click the refresh icon (next to the Arcwise icon) on the selected cells. The formulas will not compute until you click the refresh icon.

If you use the Ctrl+D (drag down) or Ctrl+R (drag right) keyboard shortcuts (⌘+D / ⌘+R on Macs), a refresh will be triggered automatically.
{% endtab %}

{% tab title="Pasting formulas" %}
You can copy the formula and paste it into the other cells:

<figure><img src="/files/rHZ1cf6hXOTECeCL0bvJ" alt="" width="346"><figcaption></figcaption></figure>

When you do this you will see a block of `#N/A` values and a shimmer. This indicates that the AI formulas are computing. When they are done computing you will see the resulting values.
{% endtab %}
{% endtabs %}


# GPT Formula Reference

{% hint style="info" %}
Each of these formulas are demonstrated in our public template. [Arcwise - Public Template](https://docs.google.com/spreadsheets/d/15QAnr4uISOVpHHkfT8z1B_d2IOdUaw3r-eeP33da-JA/copy?usp=sharing)
{% endhint %}

### Model usage

All Arcwise AI functions use the [OpenAI gpt-4o](https://openai.com/index/hello-gpt-4o/) models through Microsoft Azure. We take data privacy and security seriously: both our [privacy policy](https://arcwise.app/notices/privacy) and [Azure's privacy policies](https://learn.microsoft.com/en-us/legal/cognitive-services/openai/data-privacy) guarantee that your data will never be sold or used for model training purposes.

For a limited time only, usage of AI formulas **is completely free**. (This will likely change at some point in the future!)

### AI.TRANSFORM

Transforms a target value based on a prompt.

**Examples**

```excel-formula
AI.TRANSFORM("Moby Dick", "write a short summary")
AI.TRANSFORM(A1, "write a short summary")
AI.TRANSFORM(A1, A2)
```

**Syntax**

```excel-formula
AI.TRANSFORM(VALUE_TO_BE_TRANSFORMED, PROMPT)
```

### AI.CLASSIFY

Classifies a value based on a list of categories. The list of categories can come from a range of cells.

**Examples**

```excel-formula
AI.CLASSIFY("Moby Dick", "novel, article, snoozefest")
AI.CLASSIFY("Moby Dick", $A$1:$A$3)
AI.CLASSIFY(B1, $A$1:$A$3)
```

**Syntax**

```excel-formula
AI.CLASSIFY(VALUE_TO_BE_CLASSIFIED, categories, [descriptions])
```

`categories` can be a comma separated list of values or a range of cells.

Optionally, you can also provide a range of `descriptions` to provide more information about each category. For example, if you had a table of customer support tickets, you could define a table of ticket categories and descriptions in a `categories` sheet:

<table><thead><tr><th width="71" data-type="number"> </th><th width="231">A</th><th>B</th></tr></thead><tbody><tr><td>1</td><td>Return request</td><td>If the customer is trying to return an item</td></tr><tr><td>2</td><td>Billing issue</td><td>If there's an issue with the payment method</td></tr><tr><td>3</td><td>Quality issue</td><td>If there's an issue with the delivered product</td></tr></tbody></table>

This formula would then categorize A1 based on both the categories and the descriptions:

```excel-formula
AI.CLASSIFY(A1, categories!$A$1:$A$3, categories!$B$1:$B$3)
```

### AI.EXTRACT

Extracts a fact or data point from the input. For example, part of an address, or a person's name from an email, etc.

**Examples**

```excel-formula
AI.EXTRACT("123 Main St. Jersey City, NJ 07302", "state")
AI.EXTRACT(A1, "state")
AI.EXTRACT(A1, B1)
```

**Syntax**

```excel-formula
AI.EXTRACT(VALUE_TO_EXTRACT_FROM, ITEM_TO_BE_EXTRACTED)
```


# ¡Bienvenido a Arcwise!

Arcwise es una plataforma de informes y análisis de datos basada en IA con una profunda integración con Google Sheets. Para comenzar de inmediato agregue nuestro [Chrome Extension](https://chrome.google.com/webstore/detail/arcwise/gcambpmifmpmaenjfjlelhpmelbinnil).

Con Arcwise puedes:

* Conectar datos de tu base de datos y herramientas favoritas: [Conectando Datos](/espanol/conectando-datos/conectando-datos)
* Trabajar con conjuntos de datos grandes: [Trabajar con Grandes Datos](/espanol/usando-arcwise-en-google-sheets/trabajar-con-grandes-datos)
* Utilice IA para encontrar los datos correctos o ayudar con tu análisis: [Descripción General del Analista IA](/espanol/usando-arcwise-ia/descripcion-general-del-analista-ia)<br>


# Configuración de Arcwise

¡Gracias por probar Arcwise! Estamos muy entusiasmados de trabajar con usted y permitir que los usuarios de Google Sheets accedan, analicen y visualicen datos en su almacén de datos.&#x20;

En este manual, lo guiaremos a través de los pasos necesarios para comenzar a utilizar Arcwise.

{% content-ref url="/pages/LqMWJFWWt4qjrix0UBoc" %}
[Gestión de Usuarios y Roles](/espanol/configuracion-de-arcwise/gestion-de-usuarios-y-roles)
{% endcontent-ref %}

{% content-ref url="/pages/nrcOIiqOY0PhMr0pDXll" %}
[Conectar el Almacén de Datos](/espanol/configuracion-de-arcwise/conectar-el-almacen-de-datos)
{% endcontent-ref %}

{% content-ref url="/pages/sYFPl7us0kr7XIx7bQTL" %}
[Añadir a Google Workspace](/espanol/configuracion-de-arcwise/anadir-a-google-workspace)
{% endcontent-ref %}


# Gestión de Usuarios y Roles

El portal administrativo de Arcwise en [https://admin.arcwise.app](https://admin.arcwise.app/) es la forma central de administrar (1) el acceso de los usuarios a Arcwise y (2) las conexiones a instancias de Snowflake y dbt.

### Iniciar sesión en el portal de administración

1. Navegar a <https://admin.arcwise.app>
2. Haga clic en "Iniciar sesión con Google" y elija su cuenta corporativa de Google Workspace (es decir, <nombre@empresa.com>, no su cuenta de Gmail).
3. Si tiene éxito, debería acceder a la página "Administrar usuarios" donde puede administrar los usuarios de su organización.

<figure><img src="/files/vkQ9kBduZ5i5G7mncz5a" alt=""><figcaption></figcaption></figure>

### Invitar a los usuarios

1. Haga clic en el botón "Invitar usuario" en el lado derecho de la página. Esto debería abrir un formulario de "Invitar usuario" con campos de correo electrónico y función.
2. Ingrese la dirección de correo electrónico de la empresa para el usuario que desea agregar.
3. Seleccione un **rol** para este usuario:
   1. **Admin:** Tiene permisos de administración completos en el portal de administración de Arcwise (puede agregar/eliminar/reasignar roles de usuario y editar todas las conexiones de datos).
   2. **Editor:** Puede editar conexiones de datos en el portal de administración pero no roles de usuario.
   3. **User:** Usuario final de la aplicación Arcwise. Podrá iniciar sesión y acceder a los datos conectados a través del complemento Google Sheets, pero no en el portal de administración.
4. Una vez que presione guardar, se otorgará el acceso. (NOTA: Por el momento no enviaremos ninguna notificación por correo electrónico).
5. El acceso se puede eliminar mediante los botones "Eliminar". También puede hacer clic en las entradas de la columna "Rol" para cambiar el rol de un usuario.


# Añadir a Google Workspace

Arcwise requiere la instalación de una extensión de Chrome. Esto se puede hacer a nivel individual o a nivel de administrador (si es administrador de Google Workspace).

## Chrome extension

* Arcwise Chrome extension: <https://chrome.google.com/webstore/detail/arcwise/gcambpmifmpmaenjfjlelhpmelbinnil>
  * Haga clic en "Agregar a Chrome" para agregarlo a su navegador (para instalación individual).
* Suponiendo que Chrome se administra en dispositivos de la empresa, [siga las instrucciones de Google](https://support.google.com/chrome/a/answer/6306504) para instalar automáticamente la extensión Arcwise para los dispositivos de los usuarios.
  * De lo contrario, los usuarios deberán instalar ellos mismos la extensión de Chrome.
* La extensión de Chrome se utiliza para mostrar un ícono persistente de Arcwise en la esquina superior derecha de Google Sheets. Haga clic en el icono de Arcwise e inicie sesión para acceder a Arcwise más fácilmente.
  * Utilice Cmd+Shift+1 (Ctrl+Shift+1 en Windows) para abrir la ventana emergente Arcwise.

<figure><img src="/files/rMDBNIZF9wqWuA1ZEs0y" alt=""><figcaption></figcaption></figure>


# Conectar el Almacén de Datos

{% hint style="warning" %}

### Antes de que empieces

Si aún no lo ha hecho, agregue usuarios que necesitarán acceso mientras configura su conexión de almacén de datos: [Gestión de Usuarios y Roles](/espanol/configuracion-de-arcwise/gestion-de-usuarios-y-roles)
{% endhint %}

{% hint style="info" %}
Si necesita agregar una dirección IP fija a su lista de permitidos de almacén de datos o política de red, consulte nuestra  [Dirección IP Fija de Arcwise](/espanol/configuracion-de-arcwise/conectar-el-almacen-de-datos/direccion-ip-fija-de-arcwise) page.
{% endhint %}

### Select your warehouse:

{% content-ref url="/pages/QlNP8cYEbo828lQDPL6g" %}
[Snowflake](/espanol/configuracion-de-arcwise/conectar-el-almacen-de-datos/snowflake)
{% endcontent-ref %}

{% content-ref url="/pages/37EBgFUCX1oxycFmz8ye" %}
[BigQuery](/espanol/configuracion-de-arcwise/conectar-el-almacen-de-datos/bigquery)
{% endcontent-ref %}

{% content-ref url="/pages/tzHZxCFC94B0XHtIpjwX" %}
[Postgres](/espanol/configuracion-de-arcwise/conectar-el-almacen-de-datos/postgres)
{% endcontent-ref %}

{% content-ref url="/pages/2WZAiPW8nTCcmClnFNSH" %}
[Databricks](/espanol/configuracion-de-arcwise/conectar-el-almacen-de-datos/databricks)
{% endcontent-ref %}

{% content-ref url="/pages/oWhD8coy7mmbJPU08FDa" %}
[Athena](/espanol/configuracion-de-arcwise/conectar-el-almacen-de-datos/athena)
{% endcontent-ref %}


# Dirección IP Fija de Arcwise

If your data warehouse has an IP allowlist or a network policy defined, you’ll need to allow our IP address through:

### `34.168.52.147`

See the screenshot below for an example of applying a [network policy on Snowflake](https://docs.snowflake.com/en/user-guide/network-policies.html).

{% hint style="warning" %}
**Note:** For Snowflake, if this is the first network policy you are creating this will also **turn on your network policies** for the first time. Be sure to verify other applications retain access to your warehouse in this case.
{% endhint %}

<figure><img src="/files/qnl9x6ipiHBQgC70Futh" alt="" width="375"><figcaption></figcaption></figure>


# Snowflake

## Paso 1: cree un nuevo usuario/rol para Arcwise

Recomendamos crear un usuario y una función de Snowflake separados para el acceso a Arcwise para tener una mejor visibilidad y una gestión de acceso granular. (Es posible saltar al paso 2 y proporcionar en su lugar un conjunto de credenciales existente).

## (Opcional) Permitir la conexión desde la dirección IP de Arcwise

Si necesita agregar una dirección IP fija a su lista de permitidos o política de red, consulte nuestra[Dirección IP Fija de Arcwise](/espanol/configuracion-de-arcwise/conectar-el-almacen-de-datos/direccion-ip-fija-de-arcwise) página.

### Crear un nuevo usuario/rol

Aquí proporcionamos un script para ayudar con la creación de roles y usuarios. Puede pegar esto directamente en Snowsight si tiene privilegios **SYSADMIN** o **ACCOUNTADMIN**.

{% hint style="danger" %}
**IMPORTANTE**

* ¡Tenga cuidado de reemplazar los **valores resaltados** en la consulta a continuación!
* **¡Asegúrese de ejecutar todas las consultas!** Seleccione todo el texto de la consulta antes de ejecutarla si usa Snowsight, o marque la casilla de verificación "Todas las consultas" si usa la consola heredada.
  {% endhint %}

De forma predeterminada, esto permitirá que la función Arcwise acceda a todos los esquemas en `$database_name`, pero esto se puede restringir si se prefiere (consulte `GRANT USAGE ON SCHEMA` resaltado a continuación). ¡Asegúrese de que cada consulta se ejecute correctamente!

```sql
-- (Optional) Edit these if you prefer something else.
SET role_name = 'ARCWISE_ROLE';
SET user_name = 'ARCWISE_USER';
-- (Optional) You can also use an existing warehouse if desired.
SET warehouse_name = 'ARCWISE_WAREHOUSE';

-- Define a password for the Arcwise user (ideally randomly generated). Remember it for later
SET user_password = '<your-password-here>';

-- Database you want to allow Arcwise to access and snapshot schema that
-- will be created in that database for data snapshot management
SET database_name = '<your-database-here>';
SET snapshot_schema_name = '_ARCWISE_SNAPSHOTS';

-- Database setup
CREATE DATABASE IF NOT EXISTS IDENTIFIER($database_name) COMMENT = 'Arcwise database';

-- Warehouse setup
CREATE WAREHOUSE IF NOT EXISTS IDENTIFIER($warehouse_name)
	warehouse_size = small
	warehouse_type = standard
	auto_suspend = 15
	auto_resume = true
	initially_suspended = true;

-- Role setup
CREATE ROLE IF NOT EXISTS IDENTIFIER($role_name) COMMENT = 'Arcwise default role';

-- User setup
CREATE USER IF NOT EXISTS IDENTIFIER($user_name)
	password = $user_password
	first_name = 'Arcwise'
	last_name = 'User'
	default_warehouse = $warehouse_name
	default_role = $role_name;

-- Assign user -> role
GRANT ROLE IDENTIFIER($role_name) TO USER IDENTIFIER($user_name);

-- Allow role -> warehouse & database
GRANT USAGE ON WAREHOUSE IDENTIFIER($warehouse_name) TO ROLE IDENTIFIER($role_name);
GRANT USAGE ON DATABASE IDENTIFIER($database_name) TO ROLE IDENTIFIER($role_name);

-- Allow role to access all schemas (and tables/views within the schema)
GRANT USAGE ON ALL SCHEMAS IN DATABASE IDENTIFIER($database_name) TO ROLE IDENTIFIER($role_name);
GRANT USAGE ON FUTURE SCHEMAS IN DATABASE IDENTIFIER($database_name) TO ROLE IDENTIFIER($role_name);
-- (Optional) To restrict access to certain schemas: comment out the two lines above and edit below
-- GRANT USAGE ON SCHEMA <your-database>.<your-schema> TO ROLE IDENTIFIER($role_name);

GRANT SELECT ON ALL TABLES IN DATABASE IDENTIFIER($database_name) TO ROLE IDENTIFIER($role_name);
GRANT SELECT ON FUTURE TABLES IN DATABASE IDENTIFIER($database_name) TO ROLE IDENTIFIER($role_name);

GRANT SELECT ON ALL VIEWS IN DATABASE IDENTIFIER($database_name) TO ROLE IDENTIFIER($role_name);
GRANT SELECT ON FUTURE VIEWS IN DATABASE IDENTIFIER($database_name) TO ROLE IDENTIFIER($role_name);

-- Create snapshot schema and grant role ownership over that schema
SET arcwise_snapshots_schema = $database_name || '.' || $snapshot_schema_name;
CREATE SCHEMA IF NOT EXISTS IDENTIFIER($arcwise_snapshots_schema) COMMENT = 'Arcwise-operated schema for managing data snapshots';
GRANT OWNERSHIP ON SCHEMA IDENTIFIER($arcwise_snapshots_schema) TO ROLE IDENTIFIER($role_name) REVOKE CURRENT GRANTS;

-- Allow Arcwise role to analyze query history & table usage activity
GRANT IMPORTED PRIVILEGES ON DATABASE SNOWFLAKE TO ROLE IDENTIFIER($role_name);
```

By default the above commands will *not* give the `SYSADMIN` role access to data managed by Arcwise. To have the Arcwise role inherit from `SYSADMIN` and therefore grant that role full access run the following command:

```sql
GRANT ROLE IDENTIFIER($role_name) TO ROLE SYSADMIN;
```

### Paso 2: agregue las credenciales de Snowflake en Arcwise

1. Vaya a la pestaña "Conexiones" en el panel de administración de Arcwise (<https://admin.arcwise.app/#/warehouse_connections>)
2. Haga clic en el botón "Crear" para agregar la primera conexión.
3. Complete las credenciales según las variables que completó anteriormente. Se pueden encontrar instrucciones adicionales para cada sección a continuación.

<figure><img src="/files/GVNvVbjmJUans0flpbAq" alt="" width="563"><figcaption></figcaption></figure>

<details>

<summary>Nombre</summary>

Un nombre fácil de usar que describe el propósito de la conexión. Se mostrará a los usuarios finales en Arcwise.

</details>

<details>

<summary>Cuenta</summary>

Este es el [identificador de su cuenta Snowflake](https://docs.snowflake.com/en/user-guide/admin-account-identifier#using-an-account-locator-as-an-identifier). Debe estar en el formato:

`account_locator.cloud_region_id.cloud`

EG: `uc1234.us-west-1.aws`&#x20;

En Snowsight, puede pasar el cursor sobre el menú de la cuenta en la parte inferior izquierda y hacer clic en **Copiar URL de la cuenta**; luego elimine el `https://` inicial y el `.snowflakecomputing.com` final

<img src="/files/6Ky0jt67Qj9jOMiaIP7O" alt="" data-size="original">

</details>

<details>

<summary>Depósito</summary>

Utilice el valor `$warehouse_name` de la consulta SQL (por ejemplo, `ARCWISE_WAREHOUSE`)

</details>

<details>

<summary>Base de Datos</summary>

Utilice el valor `$database_name` de la consulta SQL.

</details>

<details>

<summary>Esquema de instantánea</summary>

Utilice el valor `$snapshot_schema_name` de la consulta SQL.

</details>

<details>

<summary>Usuario Contraseña</summary>

`$user_name` y `$user_password` de la consulta SQL.

</details>

Todas las credenciales se almacenan de forma segura mediante cifrado de nivel bancario (256 bits). Una vez que presione Guardar y se haya agregado la conexión, puede cambiar a la pestaña "Tablas" para ver todas las tablas que estarán expuestas en Arcwise.

{% hint style="warning" %}
Si recibe un error que indica que el nombre de usuario/contraseña no funcionó, verifique que todas las consultas en el script "Crear un nuevo usuario/rol" se hayan ejecutado correctamente.
{% endhint %}


# BigQuery

{% hint style="info" %}
If your organization uses Google Cloud [Private Service Connect](https://cloud.google.com/vpc/docs/private-service-connect), Arcwise can’t support it yet. Please let us know if this is something you need!
{% endhint %}

## Step 1: Create a Service Account in GCP

1. Choose an existing service account or create a new one. Instructions on setting up a GCP service account can be found [here](https://cloud.google.com/iam/docs/creating-managing-service-accounts). We recommend a new service account: `Arcwise`
2. Grant the service account the proper level of access to BigQuery. More information on permissions [here](https://cloud.google.com/bigquery/docs/access-control-basic-roles). Access should be granted from IAM management. Minimally, Arcwise requires:
   1. BigQuery Job User
   2. BigQuery Read Session User
   3. BigQuery Data Viewer (\* This can be granted on a [per-dataset level](https://cloud.google.com/bigquery/docs/control-access-to-resources-iam#grant_access_to_a_dataset) to only the datasets you would like Arcwise to access)
3. Create a dataset in BigQuery called `arcwise_snapshots`. For more information on creating datasets see [here](https://cloud.google.com/bigquery/docs/datasets).
   * Arcwise will use this dataset to create zero-cost [table snapshots](https://cloud.google.com/bigquery/docs/table-snapshots-intro) of tables that have been connected to Google Sheets.
4. Grant the service account the proper level of access to the `arcwise_snapshots` dataset. For information on how to grant access to an individual dataset see [here](https://cloud.google.com/bigquery/docs/control-access-to-resources-iam#console). Grant the following access:
   1. BigQuery Data Owner
5. Generate a JSON Key file for the service account. This will be used later.

### Step 2: Link Account to Arcwise

Navigate to <https://admin.arcwise.app/> and go to the connections tab.

Open your JSON key file and copy+paste the contents into the textbox, then press Save.

<figure><img src="/files/t3dcNQpQvbfcXCCRGfG9" alt="" width="375"><figcaption></figcaption></figure>


# Postgres

## (Optional) Create `arcwise USER` in your database

If you plan to use an existing user ignore this step. The existing user must be granted `USAGE` and `SELECT` privileges on the schema(s) you plan to use with Arcwise.

To create a new user follow these steps in `psql`.

```sql
CREATE USER arcwise WITH PASSWORD '{ENTER_PASSWORD_HERE}';

-- Grant usage on the schema and select privileges on the tables
GRANT USAGE ON SCHEMA public TO arcwise;
GRANT SELECT ON ALL TABLES IN SCHEMA public TO arcwise;

-- OPTIONAL - Revoke select for table(s) that you would prefer to hide 
REVOKE SELECT ON TABLE {your_hidden_table} from arcwise;
```

## (Optional) Allow connection from Arcwise IP address

If you need to add a fixed IP address to your allowlist or network policy, please refer to our  [Dirección IP Fija de Arcwise](/espanol/configuracion-de-arcwise/conectar-el-almacen-de-datos/direccion-ip-fija-de-arcwise) page.

### Link Account to Arcwise

Navigate to <https://admin.arcwise.app/> and go to the connections tab.

Input the required fields to link with the user created in Step 1


# Databricks

## (Optional) Allow connection from Arcwise IP address

If you need to add a fixed IP address to your allowlist or network policy, please refer to our  [Dirección IP Fija de Arcwise](/espanol/configuracion-de-arcwise/conectar-el-almacen-de-datos/direccion-ip-fija-de-arcwise) page.

## Add Databricks credentials in Arcwise

1. Log into the Arcwise Admin portal and [set up users/roles for your team first](/espanol/configuracion-de-arcwise/gestion-de-usuarios-y-roles).
2. Go to the “Connections” tab in the Arcwise admin panel (<https://admin.arcwise.app/#/warehouse_connections>)
3. Click on the “+ Create” button (top-right) and select "Databricks" from the Warehouse Type dropdown.

<figure><img src="/files/HeXq151mWsQDRAY0v5D0" alt="" width="563"><figcaption><p>(You should see these fields for Databricks connections).</p></figcaption></figure>

### Information about required fields

1. **Name** - A user-friendly name used for display purposes in the Arcwise interface. Can be anything you want.
2. **Server Hostname / HTTP Path**
   1. Follow the Databricks documentation on finding these fields - for compute clusters, this will be on the **Advanced Options > JDBC/ODBC** settings page, and for SQL warehouses this will be under **Connection Details**. <https://docs.databricks.com/integrations/jdbc-odbc-bi.html#retrieve-the-connection-details>&#x20;
3. **Personal Access Token** - must be an access token with permissions to use the warehouse/cluster provided above. See the docs for the required permissions: <https://docs.databricks.com/integrations/jdbc-odbc-bi.html#permission-requirements>
   1. *Arcwise only requires read permissions. We recommend that you ensure the PAT has finer-grained permissions for safety purposes; Arcwise users can execute SELECT SQL queries to access any schemas and tables that the PAT has (read) access to.*
4. **Catalog** - The top-level catalog (as shown in Databricks' Data Explorer) that you would like Arcwise to access. **If you're not using Unity Catalog, this must be `hive_metastore`.**

### **Checking indexed tables/views**

Arcwise will automatically index your data catalog upon the initial connection; our index will also automatically refresh every day at midnight PST.

Go to the [Tables page](https://admin.arcwise.app/#/warehouse_entities) in the Arcwise panel to see the list of indexed tables / views.

To manually re-index tables, you can press the "Sync" button back on the [Connections page](https://admin.arcwise.app/#/warehouse_connections).

### (Optional) Connecting to dbt

Arcwise supports indexing your dbt catalog to surface metrics and models in the UI. If you'd like us to do this, proceed to the next step to connect your dbt credentials.


# Athena

## (Optional) Allow connection from Arcwise IP address

If you need to add a fixed IP address to your allowlist or network policy, please refer to our  [Dirección IP Fija de Arcwise](/espanol/configuracion-de-arcwise/conectar-el-almacen-de-datos/direccion-ip-fija-de-arcwise) page.

## Add Athena credentials in Arcwise

1. Log into the Arcwise Admin portal and [set up users/roles for your team first](/espanol/configuracion-de-arcwise/gestion-de-usuarios-y-roles).
2. Go to the “Connections” tab in the Arcwise admin panel (<https://admin.arcwise.app/#/warehouse_connections>)
3. Click on the “+ Create” button (top-right) and select "Athena" from the Warehouse Type dropdown.

<figure><img src="/files/CRdd6xwif8qzwpxDsi8P" alt="" width="563"><figcaption><p>Required information for Athena connections</p></figcaption></figure>

### Information about required fields

1. **Name**
   * A user-friendly name used for display purposes in the Arcwise interface. Can be anything you want.
2. **AWS Access Key ID / Secret Access Key**
   * An access key ID / secret pair for the role that should run the Athena queries. The IAM role must have access to Athena and S3. <https://docs.aws.amazon.com/IAM/latest/UserGuide/id_credentials_access-keys.html>
3. **Region**
   * The AWS region that Athena will run in (e.g. `us-west-2`)
4. **Catalog**
   * The catalog (normally this should just be the default: `awsdatacatalog`). <https://docs.aws.amazon.com/athena/latest/ug/understanding-tables-databases-and-the-data-catalog.html>
5. **S3 Staging Directory**
   * Athena requires a S3 bucket path to store the results of queries. The access key / secret must have write access to this bucket. *NOTE: you may want to set up the bucket lifecycle to automatically purge old query results automatically. Arcwise doesn't require past query results to be accessible.*

### **Checking indexed tables/views**

Arcwise will automatically index your data catalog upon the initial connection; our index will also automatically refresh every day at midnight PST.

Go to the [Tables page](https://admin.arcwise.app/#/warehouse_entities) in the Arcwise panel to see the list of indexed tables / views.

To manually re-index tables, you can press the "Sync" button back on the [Connections page](https://admin.arcwise.app/#/warehouse_connections).


# S3

Arcwise supports any S3-compatible storage bucket as as a destination for third-party integrations. See [Connecting to Integrations](/espanol/configuracion-de-arcwise/integraciones/descripcion-general) for more details. (Arcwise will create a Parquet file every time you pull data from an integration like Salesforce or Hubspot.)

## Add S3 credentials in Arcwise

1. Log into the Arcwise Admin portal and [set up users/roles for your team first](/espanol/configuracion-de-arcwise/gestion-de-usuarios-y-roles).
2. Go to the “Connections” tab in the Arcwise admin panel (<https://admin.arcwise.app/#/warehouse_connections>)
3. Click on the “+ Create” button (top-right) and select "S3" from the Warehouse Type dropdown.

<figure><img src="/files/Mpi4FC7YxwC4O396aCsL" alt=""><figcaption></figcaption></figure>

### S3 compatibility for other clouds

Almost all the major cloud storage bucket solutions are S3-compatible. Here are some links for the major cloud providers:

* [Google Cloud Storage](https://cloud.google.com/storage/docs/interoperability) - set up an HMAC key and use `https://storage.googleapis.com` as the endpoint override
* [Cloudflare R2](https://developers.cloudflare.com/r2/api/s3/api/)
* Azure Storage currently doesn't have a built-in S3 compatibility layer, but there are [open source proxy](https://github.com/gaul/s3proxy) solutions.


# Conexión de Herramientas de Datos


# Conéctate a dbt

Once you’ve set up the initial data warehouse connection, you can add dbt jobs linked to the warehouse account.

{% hint style="info" %}
**NOTE:** this requires `Job Viewer` role access to a dbt Cloud account.
{% endhint %}

## Adding DBT

1. In the **Connections** tab, click on the connection that should have linked dbt jobs.
2. Go to the **dbt connections** section and click the **Add dbt connection** button.<br>

   <figure><img src="/files/ut6giCEOYcJCSC7fQaE3" alt="" width="375"><figcaption></figcaption></figure>
3. Fill in the form with the required details. See below for additional details.<br>

   <figure><img src="/files/dOi9eFdBs4jxticmE1Fc" alt=""><figcaption></figcaption></figure>

## Form Details

<details>

<summary>Account and job ID</summary>

In dbt Cloud, navigate to the **Jobs** list under the **Deploy** menu. Click on the job that you want to connect to Arcwise (if you have multiple jobs, please select the job that builds your dbt docs, i.e. it includes a dbt docs generate step). The URL should be in the form&#x20;

`https://cloud.getdbt.com/next/deploy/[ACCOUNT-ID]/projects/[PROJECT_ID]/jobs/[JOB_ID]`

Copy and paste the account and job numbers into the Arcwise form.

![](/files/8cBeat3xgi5YitlCmzI3)

</details>

<details>

<summary>Service token</summary>

See instructions in [dbt docs for generating a service token](https://docs.getdbt.com/docs/dbt-cloud-apis/service-tokens). The token must have access to both the **Metadata API** and **Job Admin**.

</details>

<details>

<summary>Semantic Layer Proxy URL</summary>

If you want to allow Arcwise to use [dbt metrics](https://docs.getdbt.com/docs/build/metrics), then you’ll need to link Arcwise to the dbt Semantic Layer. Follow the [semantic layer setup instructions from the dbt docs](https://docs.getdbt.com/docs/use-dbt-semantic-layer/setup-dbt-semantic-layer) (if you haven’t already) and paste the proxy URL from your job’s environment into Arcwise.

</details>

## Indexing

After the dbt connection has been successfully saved, navigate to the “Tables” tab and you should see the models and metrics belonging to your dbt job.

{% hint style="info" %}
By default, Arcwise will index all models and metrics linked to the job that have not been marked as hidden from dbt docs. To hide things from Arcwise, you can set the `docs` config to `show: false` - please see the [official dbt docs](https://docs.getdbt.com/reference/resource-configs/docs#mark-a-model-as-hidden) for how to do this for an individual model or entire folders.
{% endhint %}


# Conéctate a Looker

{% hint style="info" %}

### Before you Begin

If you haven’t already, add users that will require access while setting up your data warehouse connection: [Gestión de Usuarios y Roles](/espanol/configuracion-de-arcwise/gestion-de-usuarios-y-roles)
{% endhint %}

## Creating Service Account in Looker Admin

Complete the steps below to create a Service Account in Looker using a Looker admin account.  \
\
This step is only necessary if you do not already have a Service Account set up in Looker.  If you already do, you can skip ahead to [#configuring-service-account-in-looker-admin](#configuring-service-account-in-looker-admin "mention")

1. On the left-side options, select Admin > Users to go to the User Admin panel and select Add Service Accounts on the top right (see screenshot below).

   <figure><img src="/files/3ThSPiDeW8CwjH982jzN" alt=""><figcaption></figcaption></figure>
2. On the next screen, add an email for the Service Account and make sure they have the role of "Admin".  After creation, you should be dropped into a User edit view, like the one shown in the section below. &#x20;

## Configuring Service Account in Looker Admin

1. Go to edit the Service Account user account in Looker.  If the service account doesn't already have a name, fill out the first and last name to "Arcwise Service Account" as shown below and confirm that the "Admin" role is added in the Roles section.

<figure><img src="/files/v9mkaSK0EVOthNQ3hYg8" alt=""><figcaption></figcaption></figure>

2. Click on the API Keys "Edit Keys" option, highlighted with an arrow above.
3. On the next screen, click "New API Key". This will create a new key that will be used in the following section.

## Adding Looker in Arcwise Admin

1. Navigate to <https://admin.arcwise.app/> and go to the **Integrations** tab.
2. Click the "Create" button and select "Looker" as the integration type.
3. Fill in the form with the required details using the API Key you created above. See below for additional details.

## Form Details

<details>

<summary>Host URL</summary>

Your Looker URL is probably of the form <https://yourcomany.looker.com> or <https://something-random.looker.app>.  \
\
The Host URL needed here is just the root `yourcompany.looker.com` or `something-random.looker.app` part.

</details>

<details>

<summary>Client ID</summary>

This is the Client ID associated with the API Key that was generated in Looker above.

</details>

<details>

<summary>Client Secret</summary>

This is the Client Secret associated with the API Key that was generated in Looker above.  \
\
You will need to click the eye icon to the right to be able to copy/paste the Client Secret into the Arcwise admin window.

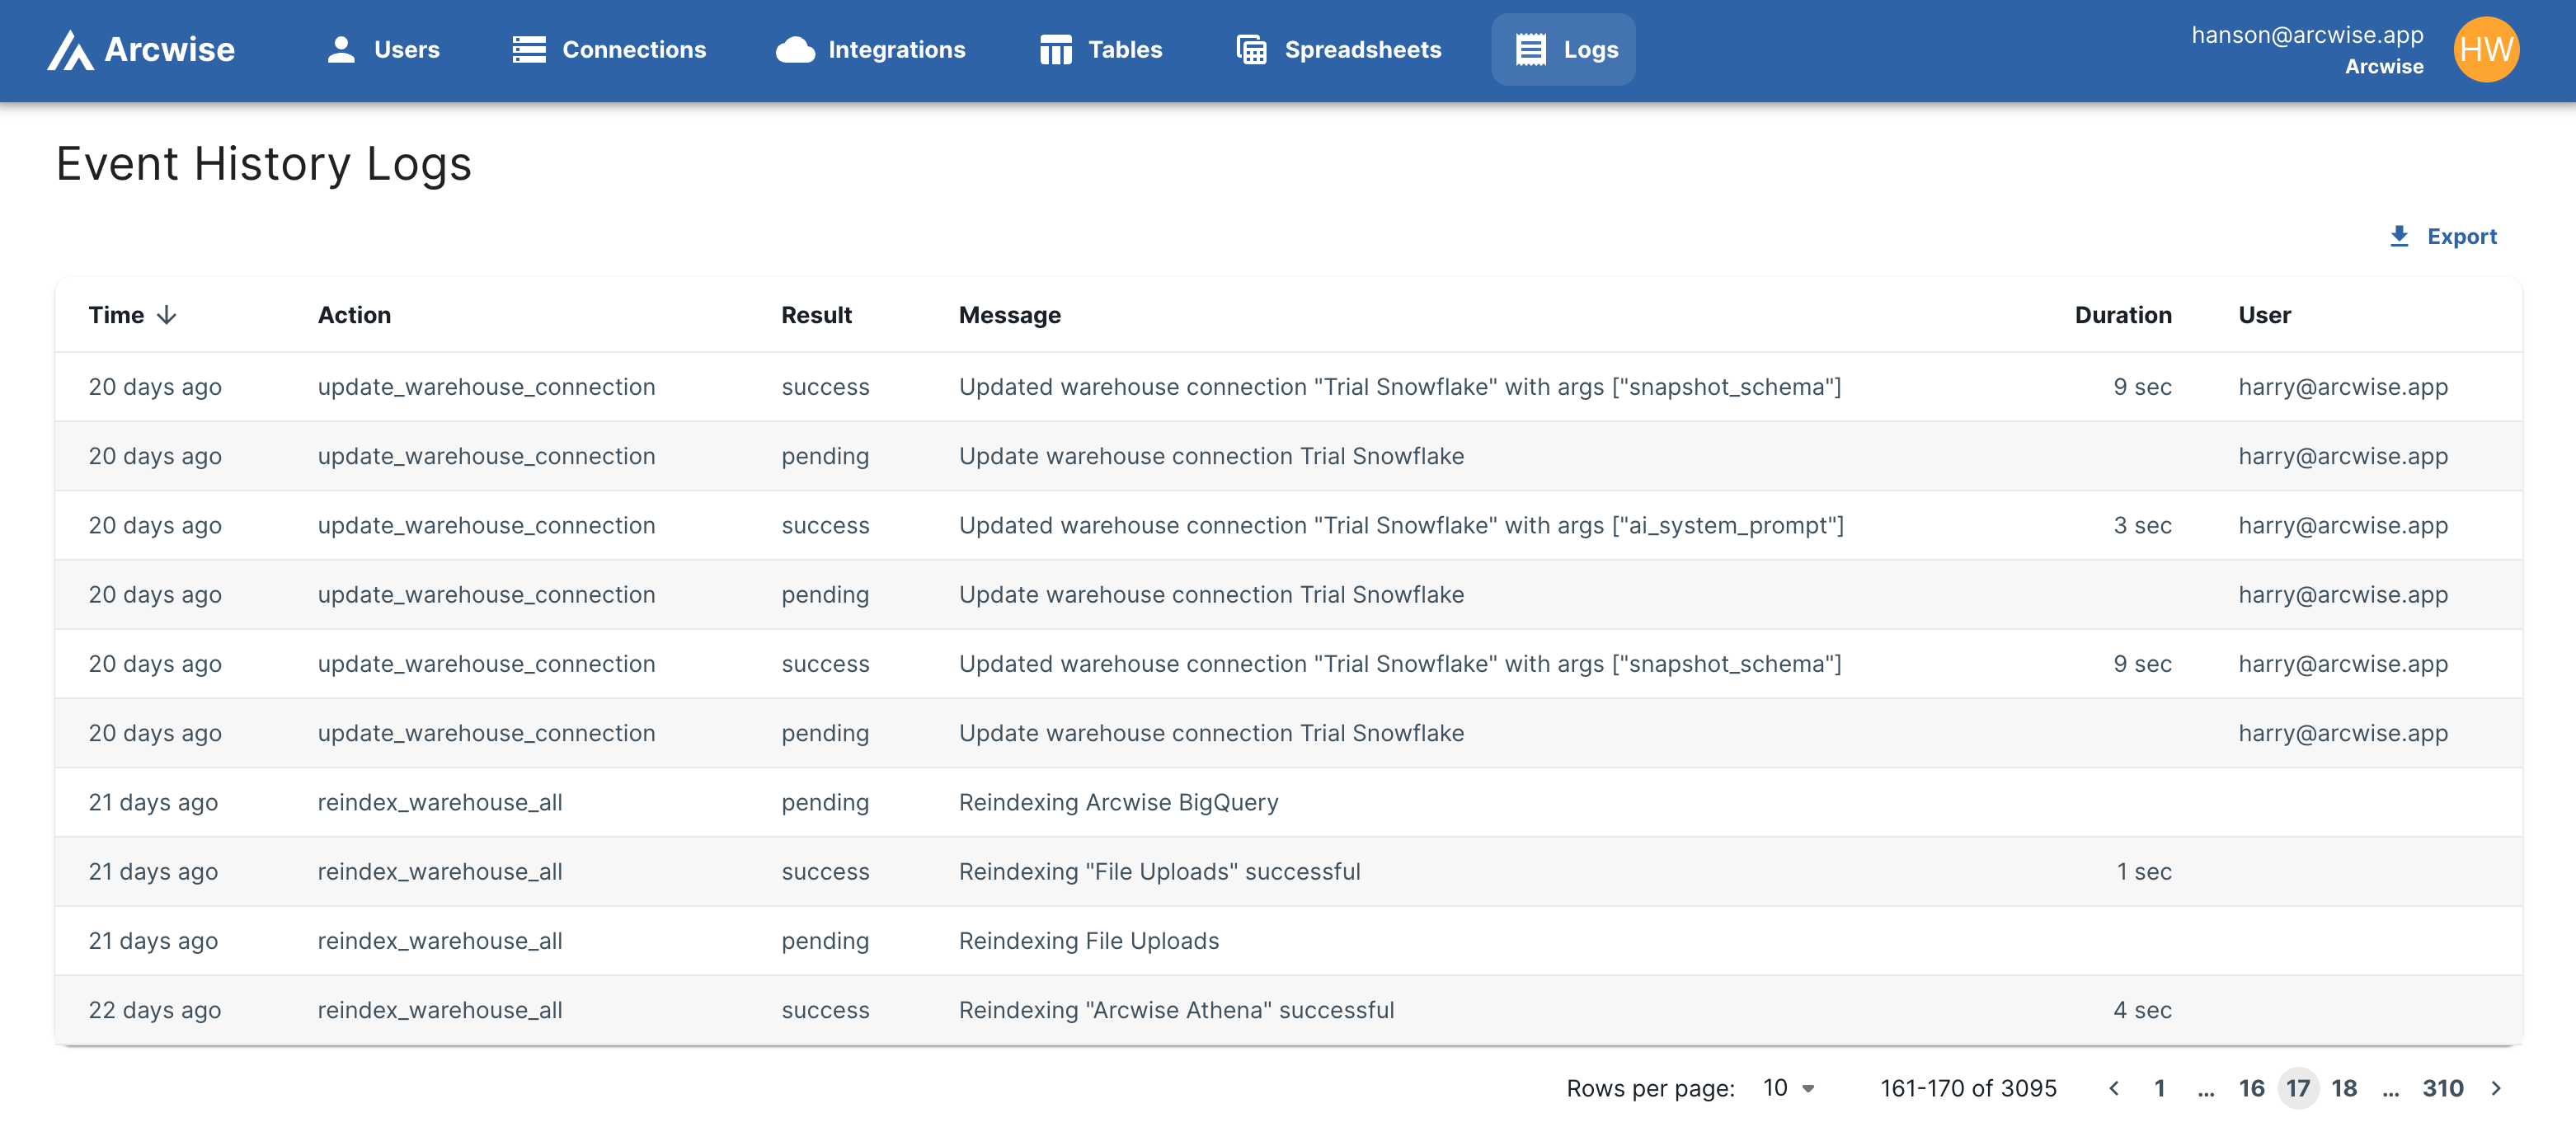
<img src="/files/1voiuFzfVx3A9gVWqdiR" alt="" data-size="original">

</details>

## Connection test

Before the Looker connection has been saved in Arcwise, it will run a test to ensure connectivity. Please note if there are any errors.  If it is able to save the record successfully, you will see it appear in <https://admin.arcwise.app/#/api_connections>.

Now, if you open the Arcwise sidebar in a Google Sheet and click "Connect Data", you should be able to paste in a Looker Look URL and import its data:

<figure><img src="/files/IGjFDfh3FtCSA9hElQup" alt=""><figcaption></figcaption></figure>


# Registro de Auditoría

The Arcwise admin panel exposes a [Logs tab](https://admin.arcwise.app/#/event_history) which shows relevant changes to warehouse connections, API integrations, user roles, and more. Audit logs can also be exported as a CSV.

<figure><img src="/files/DCiaAbvoyNIoaNT0WlfG" alt=""><figcaption></figcaption></figure>

### Logged events

Here is a (non-complete) list of events currently logged by Arcwise:

<table><thead><tr><th width="293">Event / Action</th><th>Description</th></tr></thead><tbody><tr><td>reindex_warehouse_all</td><td>Occurs nightly when Arcwise automatically re-indexes your warehouse. A failure event will be logged if any errors are encountered.</td></tr><tr><td>create_warehouse_connection<br>update_warehouse_connection</td><td>Logged when a new warehouse connection is created or one is updated.</td></tr><tr><td>create_role<br>delete_role<br>edit_role</td><td>Logged when a new user is added, deleted, or their permissions are edited</td></tr><tr><td>create_token<br>delete_token</td><td>Logged when a Personal Access Token is created or deleted by a user.</td></tr></tbody></table>

### Accessing audit logs via API

Arcwise's audit logs can be accessed via API. First, you'll need an administrator to create an API key ("personal access token").

#### Obtaining a Personal Access Token

1. Log into <https://admin.arcwise.app/>
2. Click your email / initials at the top right and select "My profile".

   <div align="left"><figure><img src="/files/AY7mXY4vPMuH0pD16h2r" alt="" width="282"><figcaption></figcaption></figure></div>
3. Scroll down to the "Personal Access Tokens" section and click "+ Create"

   <div align="left"><figure><img src="/files/dkQcxDJ5X9v8l8O82gNn" alt="" width="375"><figcaption></figcaption></figure></div>
4. Provide a name for your token (e.g. "audit\_logs") and hit "Save". Your new token should now appear in the table. Click the "copy" or "view" buttons to obtain your API token and save it to a secure location.\
   ![](/files/qtInij4H9oD2K3AS69DV)<br>
5. At any time, you can click the delete button to permanently revoke a token, at which point it will immediately lose access to Arcwise.

#### Make an HTTP request to access the event logs

Now, you can make a HTTP GET request to <https://backend.arcwise.app/api/event_history> to obtain a JSON list of all log entries within a certain timeframe.

* Set the `Authorization` header to `Bearer: <your personal access token>` to   authenticate with this endpoint.
* You can optionally pass in the following query parameters through the URL:

| Parameter        | Description                                                                                  |
| ---------------- | -------------------------------------------------------------------------------------------- |
| `from_timestamp` | A UNIX timestamp or ISO date/time string to specify the start time for retrieved event logs. |
| `to_timestamp`   | A UNIX timestamp or ISO date/time string to specify the end time for retrieved event logs.   |
| `limit`          | An integer indicating the maximum number of logs to return. (Default: 1000)                  |

* The output will be a JSON list where each entry is an object with the following keys:

<table><thead><tr><th width="210">Key</th><th>Description</th></tr></thead><tbody><tr><td><code>event</code></td><td>Name of the event (e.g. <code>add_role</code>, <code>edit_role</code>, <code>delete_role</code>)</td></tr><tr><td><code>message</code></td><td>A description of the event with more details. (may be null)</td></tr><tr><td><code>timestamp</code></td><td>The UNIX timestamp when the event took place.</td></tr><tr><td><code>severity</code></td><td>One of <code>info</code>, <code>warning</code>, or <code>error</code>.</td></tr><tr><td><code>user_id</code></td><td>The Arcwise user ID that initiated the event (may be null)</td></tr></tbody></table>

**Example cURL API request/response**

```basic
# Request
curl 'https://backend.arcwise.app/api/event_history?limit=1&from_timestamp=1700000000' \
  -H 'Authorization: Bearer 12345678-9012-3456-7890-123456789012' -X GET

# Response: 200 OK
[
  {
    "event": "create_token",
    "timestamp": 1706599957,
    "severity": "info",
    "message": "User 0000-1111-2222 created personal access token 3333-4444-5555",
    "user_id": "0000-1111-2222"
  }
]
```


# Integraciones


# Descripción General

Arcwise also has the ability to pull data via integrations with third-party software services (e.g. Salesforce, Hubspot, etc). Follow the subpages for information on each one.

One important thing to note: **Arcwise requires an attached database or data warehouse connection for each integration**. This is so that we can store persistent snapshots of your data, allowing efficient scheduled refreshes (without having to re-sync everything every time.)

Refer to the [Connect Data Warehouse](/espanol/configuracion-de-arcwise/conectar-el-almacen-de-datos) section for information on connecting a data warehouse. We support saving data into any [S3-compatible storage bucket](https://aws.amazon.com/s3/), which you can set up on all of the major cloud providers. We're also happy to set one up on your behalf 😊

* If you're comfortable with storing the data in an Arcwise-managed storage bucket, you can also select "File Uploads" as the destination warehouse. This will store imported data alongside  any CSV files you've uploaded to Arcwise (see:[Subir Archivos CSV](/espanol/conectando-datos/subir-archivos-csv))


# Hubspot

### Connecting to Hubspot

1. Go to <https://admin.arcwise.app/#/api_connections> and click the "+ Create" button.
2. Select "Hubspot" from the dropdown.
3. Select a data warehouse (where Arcwise will store snapshots). See [Overview](/espanol/configuracion-de-arcwise/integraciones/descripcion-general) for more information. You can also connect an [S3](/espanol/configuracion-de-arcwise/conectar-el-almacen-de-datos/s3) bucket.
   1. For the "Destination schema", the easiest option is to use the snapshot schema linked to the warehouse (e.g. `_arcwise_snapshots`. *Warning: this may be case-sensitive!*). You can also create a new schema if it's preferable.
4. Click the "Log in with HubSpot" button and enter your Hubspot login details. It may take a few minutes to sync the available set of tables.<br>

   <figure><img src="/files/uTik5TO0Ar9G1eMGLKzP" alt="" width="375"><figcaption></figcaption></figure>
5. Once the list of available tables appears, use the checkboxes to select which Hubspot entities should be available to connect through the Arcwise addon. Scroll down and click "Save" when finished.<br>

   <figure><img src="/files/wDBhh8Yf9lmcMKxBwtvd" alt=""><figcaption></figcaption></figure>


# Salesforce

### Connecting to Salesforce

1. Go to <https://admin.arcwise.app/#/api_connections> and click the "+ Create" button.
2. Select "Salesforce" from the dropdown.
3. Select a data warehouse (where Arcwise will store snapshots). See [Overview](/espanol/configuracion-de-arcwise/integraciones/descripcion-general) for more information. You can also connect an [S3](/espanol/configuracion-de-arcwise/conectar-el-almacen-de-datos/s3) bucket.
   1. For the "Destination schema", the easiest option is to use the snapshot schema linked to the warehouse (e.g. `_arcwise_snapshots`. *Warning: this may be case-sensitive!*). You can also create a new schema if it's preferable.
4. Click the "Log in with Salesforce" button and enter your Salesforce login details. It may take a few minutes to sync the available set of tables.

<figure><img src="/files/Uhc2icwLjwp2WbJm7tGp" alt=""><figcaption></figcaption></figure>

5. Once the list of available tables appears, use the checkboxes to select which Salesforce objects should be available to connect through the Arcwise addon. Scroll down and click "Save" when finished.<br>

   <figure><img src="/files/uG0Hm1HQCFz2xQcEuFOK" alt=""><figcaption><p>You can refer to Salesforce's <a href="https://developer.salesforce.com/docs/atlas.en-us.object_reference.meta/object_reference/sforce_api_objects_list.htm">official documentation about each object</a>.</p></figcaption></figure>

### Connecting to Salesforce objects and reports

Once connected, you should be able to access the "Integrations" tab from the Connect Data dialog and see the list of tables enabled above:

<figure><img src="/files/Hf93RfWlYJjxIAYfie0i" alt=""><figcaption></figcaption></figure>

You can also paste a link to a Salesforce report to import it. The report must be in tabular form - avoid using aggregations & groupings (these will not be imported.)

<figure><img src="/files/oov8L0sNWSuGSNNW3ro0" alt=""><figcaption></figcaption></figure>


# FAQ

### **How can I see if permissions were set properly to use Arcwise?**

Using the `ARCWISE` role (or whichever role + user you have set up) run `show tables` in Snowflake. You should see all tables you intended to share access to listed there.

### **I am having trouble granting permissions to Arcwise. What can I do?**

Reach out to us! Common issues include:

* **Snowflake:** Granting access without including grants to `FUTURE`. Often times tables will be dropped and recreated by jobs. When this happens the access is removed unless `FUTURE` is included.

### **How and when does Arcwise use database compute?**

Arcwise uses database compute in two ways:

* When using **Connect Data** Arcwise will execute a `SELECT * XXX LIMIT 1000` query to preview the data.
* When executing an Arc formula, EG `ARCCOUNT`, this is translated to an SQL query that will be executed in your warehouse.

### What does Arcwise do with access to DBT?

Arcwise does the following:

* read dbt artifacts
* read results of last dbt job
* read semantic later proxy URL (if you have it set up)

Arcwise *doesn't* run any jobs. It is sufficient to grant Arcwise `Job Viewer` permissions.

### **What does Arcwise do with access to Snowflake database data?**

Arcwise uses this access to read query history (SQL only, not data). This query history is used to present the most relevant tables, columns, and joins to Arcwise users.

### **What data is stored by Arcwise?**

For basic usage of the tool we store:

* names of tables
* names of columns

If we are granted access to Snowflake database data we additionally store query history (SQL only, not data), usage counts of tables, usage counts of columns, and usage counts of joins.


# Errores de Inicio de Sesión de Google

Resolving common Google login issues

## "\[400] Sheets permissions required"

When logging in, ensure that you authorize Arcwise to access your Google Sheets (and if your organization requires it, BigQuery).

*Note: Unfortunately, Google doesn't allow us to ask for more granular permissions. Rest assured that we won't read or modify any sheets you haven't explicitly used Arcwise in.*

<figure><img src="/files/rXqPMdQLDkY29rbjVh1W" alt=""><figcaption></figcaption></figure>

## “400 Bad Request” errors

To resolve this error, you’ll have to clear the site cookies for [accounts.google.com](http://accounts.google.com). Follow the steps in this video:

{% embed url="<https://www.loom.com/share/3e3ac5a3d2ba4acda531961be8cab218>" %}

**Step-by-step**

1. Click the settings icon (either a “knobs/filters” 🎛️ or “lock” 🔒 icon) on the left-hand side of the address bar while the current page is on the [accounts.google.com](http://accounts.google.com) login page.
2. Click “Cookies and site data”.
3. Click “Manage cookies and site data”.
4. Click the “trash can” / delete icon next to [accounts.google.com](http://accounts.google.com).
5. Reload the page. The login form should now work correctly - enter your email to continue.

If that still doesn’t work, you can also try opening this page in a new Chrome tab: `chrome://settings/content/siteDetails?site=https%3A%2F%2Faccounts.google.com` and clicking the “Clear data” button.

## Error 400: admin\_policy\_enforced

*(For enterprise Google Workspace accounts)*

<figure><img src="/files/4qasaR9VVLx1QkHtiEmL" alt="" width="375"><figcaption></figcaption></figure>

Unfortunately, if you encounter this error, you may not be able to use Arcwise unless it’s been approved by an administrator in your organization. (Reach out at [contact@arcwise.app](https://www.notion.so/Resolving-Arcwise-login-issues-cc6c90a4e8ae4cf5b0c41068e999744f?pvs=21) to speak with the team!)


# Registro de Cambios del Producto

Updates to the Arcwise product

#### 2023/12/13

* **AI Analyst**
  * Added advanced AI Analyst settings to control which tables the AI can see, as well as customization of the system prompt. Go into the [Arcwise Admin panel](https://admin.arcwise.app/#/warehouse_connections) (under "Connections") and open the "Advanced Settings" section in your warehouse connection.
  * Visualization capabilities are now more consistent, especially with multi-line plots.
  * Fix a minor overflow issue with AI Analyst result tables.
* Improved preview tables across the product (you can now select and copy+paste from the grid like a spreadsheet)
* Numeric input filters now display a list of sample values from the database.
* \[New] Formula hints: the Arcwise Chrome extension can now display tooltips with the column names and types for all Arcwise columns used in a formula.
  * [Hover over the Arcwise icon in the formula bar and click “Enable formula hints”](https://cleanshot.arcwi.se/cpH5SWMJDzRbX9kt4Tmt) to get started.
* Fixes to BigQuery SQL generation
* \[Beta] Added “Import data tabs” feature to the custom SQL editor. This allows you to reference other Arcwise-connected sheets by name in the SQL query (e.g. `SELECT * FROM Sheet1`)

#### 2023/12/11

* Improved column formula copilot suggestions
* Added additional entrypoints for the AI Analyst (Arcwise menu > "AI Analyst", new action for empty tabs)
* Lots of small bugfixes

#### 2023/11/28

* \[Beta] Support for Stripe and Google Analytics connectors. Configure them in the ["Integrations" section of the admin panel](https://admin.arcwise.app/#/api_connections).
* Internal bugfixes and improvements.

#### 2023/11/21

* Added a new flowchart UI where you can visualize the flow of data between Arcwise tabs in your sheet (go to Extensions > Arcwise > Open Flow)
  * [Screenshot](https://cleanshot.arcwi.se/vzSVxnrSt9KnhYPmDWTZ)
* You can now “drill down” into any Arcwise SQL formula to inspect the underlying rows and SQL that match your function’s criteria. Click the Arcwise icon in the formula bar (currently only works for “big data” formulas).
  * [Video demo](https://cleanshot.arcwi.se/ZPxBspD8XsBNWblTSwbJ)
    * (You may need to update your Arcwise Chrome extension to the latest version)
* We’ve added a “[Spreadsheets](https://admin.arcwise.app/#/spreadsheet_entity)” view to the admin panel, which lets you see all your org’s spreadsheets at a glance. Click into any spreadsheet to examine its connections.
  * The “[Tables](https://admin.arcwise.app/#/warehouse_entities)” view also shows the number of connected sheets per table. Click into any table to see all of its linked spreadsheets.
* Fixed a bug where the formula field’s autocompletion wasn’t working correctly.

#### 2023/11/09

* \[Beta] Experimental support for [connecting to Salesforce & Hubspot entities](/espanol/configuracion-de-arcwise/integraciones/descripcion-general).&#x20;
* Added support for SUMBY & MINBY column functions, which allow you to calculate the sum & min of groups of rows.
* Improved performance of large pivot table previews.

#### 2023/11/03

* Fixed an error where long-running data tab updates may time out. We also [added a progress indicator](https://cleanshot.arcwi.se/DbVQvR3zv28slnKDmL1h) for better visibility into what’s going on (which downstream pivots are being refreshed, etc.)
  * Downstream Arcwise formulas will now be automatically refreshed as well.
* AI Analyst: added chat histories. Chat threads are now persistent and you can revisit past threads across sessions.
  * All chat history is stored locally in your browser - we don’t store any of your data on our backend.
  * Also added the ability to ‘pop out’ the AI analyst into a popup window.
  * Access these new features [from the dropdown menu at the top-right](https://cleanshot.arcwi.se/bw4YMWzWYWHVCPjQPq18).
* When filtering on columns with thousands of distinct values, the selection dropdown will now dynamically re-fetch its populated values to match the current input.

#### 2023/10/23

* Pivot filters now dynamically fetch updated values based on your current input.
* Fix FIND() in Postgres formula fields.

#### 2023/10/19

* Fixed XLOOKUP for Postgres databases.
* AI analyst - fixed errors when conversation gets too long & improved responses for visualization requests.
* One-click “Edit SQL” in the sidebar SQL panel. [Video demo](https://www.loom.com/share/3d7a1978fa5b478ca23182568fcf3be9)
  * Note: The user will be shown a modal that explains that by doing this, they’ll convert their existing connection to a custom SQL connection.
* Automatically sets the sheet title to match the connected data name if the sheet title is a default Google Sheets title (e.g. “Sheet1”, “Sheet2”, etc).

#### 2023/10/13

* You can now preview changes to connected data tabs before saving (click the “Preview” button next to “Update Query”).
* Note: adding or editing formula fields no longer automatically saves until you press “Update Query”. [Video demo](https://cln.sh/9HsXctwSCvk7GxTcVkrK)
* \[Beta] Use the new “Team” tab in the Connect Data dialog to see your team’s Arcwise-connected spreadsheets at a glance, including all the datasets each spreadsheet is connected to.
* Simplified the SQL that Arcwise generates for most data connections (avoiding unnecessary use of CTEs)

#### 2023/10/05

* **Connect Data**
  * We’ve redesigned the Connect Data flow with all-new search results page & preview pages!
  * New: you’re also able to see the number of Arcwise sheets connected to any given table, as well as when it was last connected. By default, search results are now ranked by the number of Arcwise connections.
  * [Video walkthrough of the new connect flow](https://cln.sh/kHpdWY0Yn3XTFFN18q8Q)
* Simplified the generated SQL for most connection types.
* Fixed a bug where pivot tabs sometimes indicated spurious unsaved changes.

#### 2023/09/28

* Always write Looker looks to the Sheet as "plain table" pivots.
* When previewing data, add clearer messaging when only a preview of the dataset will fit in the spreadsheet. [Screenshot](https://cln.sh/sN382JBs9tgFZlnd0GFD)
* Add `DATEVALUE` column function to convert strings to dates.

#### 2023/09/25

* (Beta) Added support for XLOOKUP in formula fields. Use the XLOOKUP function with any search column along with a “lookup column” and a “result column” from another Arcwise table.
  * [Video demo](https://www.loom.com/share/e8274488c2d34febb7d9e3476b7fa83c)
* When writing a formula field, column names matching your current input [will now be auto-suggested alongside the function suggestions](https://cln.sh/BfhJ2Vr8MgDGFJnw3rMC).
* If you have unsaved changes to an Arcwise data or pivot sheet and switch to another sheet tab, you’ll now see [a blue banner at the top prompting you](https://cln.sh/QlH2nMKsMSVdZy7cpNJ2) to save your changes (rather than instantly discarding the unsaved changes).
* [Added a settings section to pivot tabs](https://cln.sh/dFJb21xG1ZVbBQfDgFhp), where you can adjust whether the pivot has totals, is saved as a plain table, or is auto-updated when the source data refreshes.

#### 2023/09/22

* Pivot tabs now automatically refresh when the source data tab is refreshed or updated.
* \[Beta] Added a new option in the Arcwise menu to refresh all Arcwise data and formulas in the current spreadsheet.&#x20;
  * [Video demo: All connected sheets](https://www.loom.com/share/a4952307c92747609f496fe5a365cedc), [Video demo: Single connected sheet](https://www.loom.com/share/7968f0f8b44c4a7cb410fbbcce7d95aa)
  * Find it under [Extensions > Arcwise > Refresh all connected Arcwise data and formulas](https://cln.sh/Bty7wh8NVHPPth42B9Pj).

#### 2023/09/18

* Added a row count to the “connect data” preview window (works when connecting both regular tables and SQL queries).
  * Screenshots: [when connecting table](https://cln.sh/Lk06ZxN1Shw9gLcwbDwx), when [previewing a SQL query](https://cln.sh/fgxfM03zw2znsJ5rQV94)
* **Pivot tables**
  * You can now order pivots by values - right-click an aggregation and sort by ascending or descending
  * You can now easily aggregate by year/quarter/month/week/day for date fields
  * You can now apply a limit to pivot results - toggle the “Limit results” selector in the bottom left
    * (Works in conjunction with ordering if you want e.g. the top 10 years by the sum of sales).
  * [Video demonstration of all the features above](https://www.loom.com/share/3f649b9ea67d4f28b7eda8d4e9eac019)
* **SQL editor**
  * Added autocompletion for table names, column names, and keywords
  * You can now click on tables in the left-side tree view to see their columns as well as a preview of table contents.
  * [Video demonstration of new SQL editor](https://www.loom.com/share/2e5699f16d9b4bf7b4f9fc9837ff08e2)

#### 2023/09/12

* Fix issue where custom SQL query connections were often not respecting the sheet cell limit.

#### 2023/09/09

* Looker integration - import Looks by URL
* “Connect SQL” has moved inside the “Connect Data” dialog.
  * Redesigned the “Connect Data” flow to have horizontal tabs for tables, file uploads, and SQL queries (along with a few other very minor changes.)
  * Allow for a Custom SQL query tab to be changed to an entity connect tab and vice-versa.
* Formula field & pivot value formula editors now auto-suggest column names
* Added support for additional column formula functions: AND/OR/NOT/INT/VALUE
* **Pivot tables**
  * The fields section of the Pivot Table modal is now resizable
  * You can now right-click pivot table fields to remove them


# Conectando Datos

Arcwise permite a los usuarios trabajar con varias fuentes de datos diferentes. A continuación encontrará los detalles sobre cómo importar cada tipo de fuente de datos a su hoja de cálculo usando Arcwise.

{% content-ref url="/pages/HSMb3Ojt6kD9SA0u4som" %}
[Almacén de Datos](/espanol/conectando-datos/almacen-de-datos)
{% endcontent-ref %}

{% content-ref url="/pages/hYY1EDQEOo4O7kmSibsr" %}
[Subir Archivos CSV](/espanol/conectando-datos/subir-archivos-csv)
{% endcontent-ref %}

{% content-ref url="/pages/VSzBhe3k3Fkb4E9trpII" %}
[Importar Datos de Otras Herramientas](/espanol/conectando-datos/importar-datos-de-otras-herramientas)
{% endcontent-ref %}

{% hint style="success" %}
Arcwise can work with data of any size. Millions or even billions of rows can be worked on. Do not hesitate to connect data that is very large! See [Trabajar con Grandes Datos](/espanol/usando-arcwise-en-google-sheets/trabajar-con-grandes-datos) for more details.
{% endhint %}


# Almacén de Datos

Hay tres formas alternativas de conectar datos desde su almacén de datos:

* **AI:** Esta es la opción preferida y suele ser la más sencilla. Utilice esta opción cuando desee que la IA le ayude a encontrar los datos correctos o realizar transformaciones ligeras de los datos antes de trabajar con ellos en su hoja de cálculo. Ver [Obtener Datos Usando IA](/espanol/usando-arcwise-ia/obtener-datos-usando-ia) por utilizar esta opción.
* **Catálogo de datos:** Utilice esta opción si desea conectar rápidamente una tabla conocida.
* **Conectar datos:** Utilice esta opción para explorar y buscar tablas manualmente.

{% hint style="info" %}
Si sus datos son grandes, los datos de la hoja se truncarán a 100 filas. ¡Sin embargo, aún puedes trabajar con estos datos! Ver [Trabajar con Grandes Datos](/espanol/usando-arcwise-en-google-sheets/trabajar-con-grandes-datos).
{% endhint %}

{% tabs %}
{% tab title="Catálogo de datos" %}
1\) Navegue hasta el ícono de Arcwise en la esquina superior derecha de su hoja y haga clic en él.

<div data-full-width="false"><figure><img src="/files/vJPKMaDbBN9AqoCWEH6h" alt="" width="363"><figcaption><p>The Arcwise icon appears at the top right of your Google Sheet</p></figcaption></figure></div>

2\) Desde la paleta de comandos, seleccione Ver todos los datos de conexión cerca de la parte inferior.

<figure><img src="/files/f8XAPvNhoT47IOv0890m" alt="" width="375"><figcaption></figcaption></figure>

3\) Seleccione la pestaña Catálogo de datos.

<figure><img src="/files/vTAVXS4QGCrYrRNJNW7T" alt="" width="375"><figcaption></figcaption></figure>

4\) (Opcional) Si tiene varios almacenes de datos, seleccione el almacén de datos del que desea extraer datos.

5\) Seleccione el esquema que contiene su tabla y luego la tabla que desea conectar.

<figure><img src="/files/pVQbmaikoDYpWGEymTW5" alt="" width="375"><figcaption></figcaption></figure>

6\) En la esquina inferior derecha, haga clic en el botón verde Conectar.

<figure><img src="/files/d5v1YxsJ3ouRWDC8VzxE" alt="" width="375"><figcaption></figcaption></figure>
{% endtab %}

{% tab title="Conectar datos" %}
1\) Navegue hasta el ícono de Arcwise en la esquina superior derecha de su hoja y haga clic en él.

<div data-full-width="false"><figure><img src="/files/vJPKMaDbBN9AqoCWEH6h" alt="" width="363"><figcaption><p>The Arcwise icon appears at the top right of your Google Sheet</p></figcaption></figure></div>

2\) En la paleta de comandos, seleccione Conectar datos cerca de la parte inferior.

<figure><img src="/files/f8XAPvNhoT47IOv0890m" alt="" width="375"><figcaption></figcaption></figure>

4\) Haga clic en la sección Base de datos.

<figure><img src="/files/5tyAHIXCv7Z9QzXsnsSm" alt="" width="563"><figcaption></figcaption></figure>

5\) (Opcional) busque y utilice el panel de navegación para encontrar los datos más relevantes para su tarea.

6\) Seleccione la mesa que desea conectar y haga clic en el botón verde Conectar en la esquina inferior derecha.

<figure><img src="/files/36yA5Qyw46VJRDD3QV5D" alt="" width="563"><figcaption></figcaption></figure>
{% endtab %}

{% tab title="AI" %}
[Obtener Datos Usando IA](/espanol/usando-arcwise-ia/obtener-datos-usando-ia)
{% endtab %}
{% endtabs %}


# Subir Archivos CSV

Arcwise permite a los usuarios cargar archivos CSV y TSV. Luego, estos archivos se pueden unir con otros datos de su almacén de datos o otras herramientas conectadas (Salesforce, Netsuite, etc.).&#x20;

Cargar datos como CSV a través de Arcwise también hace que sea más fácil trabajar con IA y hace que la IA sea más efectiva con esos datos.

Actualmente, solo se admiten archivos de hasta 1 GB, aunque este límite se puede aumentar comunicándose directamente con su administrador de Arcwise o con el equipo de Arcwise.

{% hint style="info" %}
Si sus datos son grandes, los datos de la hoja se truncarán a 100 filas. ¡Sin embargo, aún puedes trabajar con estos datos! Ver [Trabajar con Grandes Datos](/espanol/usando-arcwise-en-google-sheets/trabajar-con-grandes-datos).
{% endhint %}

### Subir un CSV o TSV

1\) Navegue hasta el icono de Arcwise en la esquina superior derecha de su hoja y haga clic en él.

<div data-full-width="false"><figure><img src="/files/vJPKMaDbBN9AqoCWEH6h" alt="" width="363"><figcaption><p>The Arcwise icon appears at the top right of your Google Sheet</p></figcaption></figure></div>

2\) Desde la paleta de comandos, seleccione Conectar datos en la parte inferior

<figure><img src="/files/f8XAPvNhoT47IOv0890m" alt="" width="375"><figcaption></figcaption></figure>

3\) Desde la ventana emergente, navegue hasta Cargar y seleccione el archivo CSV o TSV que desea cargar.

<figure><img src="/files/a1LHMsGHZE4RpqqkwhUq" alt="" width="563"><figcaption></figcaption></figure>

4\) Después de cargar el archivo, aparecerá una pequeña ventana emergente en la esquina inferior derecha. Haga clic en el botón azul Iniciar consulta.

<figure><img src="/files/ca4RwFitujfI7mQczMgW" alt="" width="563"><figcaption></figcaption></figure>

5\) Aparecerá una vista previa de los datos. Desde esta pantalla, haga clic en el botón verde Conectar. Esto colocará los datos en una nueva pestaña en su hoja.

<figure><img src="/files/3Hrr5Agg4pi7tIz3TTzA" alt="" width="563"><figcaption></figcaption></figure>


# Importar Datos de Otras Herramientas


# Selección de Datos de Hoja de Cálculo Para Análisis de AI


# Datos Conectados de Arcwise

Cada vez que conecte datos usando Arcwise, verá una pestaña de datos conectados a Arcwise. Esta pestaña de datos se comporta como una pestaña de hoja de cálculo normal en la mayoría de los casos. Si los datos son demasiado grandes, verá una vista previa de los datos, pero aún podrá trabajar con ellos: [Trabajar con Grandes Datos](/espanol/usando-arcwise-en-google-sheets/trabajar-con-grandes-datos).

Para interactuar con una pestaña de datos conectada a Arcwise, debe utilizar la interfaz de Arcwise para esa pestaña.

{% tabs %}
{% tab title="Usando la navegación de Google Sheets" %}
1\) Navegue a la pestaña de datos conectados de Arcwise en Google Sheets

2\) Haga clic en Editar datos en la pestaña actual en la sección Administrar datos de Arcwise

<figure><img src="/files/cT3hUJldzNwjinYeQAyL" alt="" width="375"><figcaption></figcaption></figure>
{% endtab %}

{% tab title="Usando la navegación de datos conectada" %}
1\) En la paleta de comandos, seleccione Ver todos los datos conectados cerca de la parte inferior. Alternativamente, use el pequeño ícono de conexión en la esquina superior derecha.

<figure><img src="/files/f8XAPvNhoT47IOv0890m" alt="" width="375"><figcaption></figcaption></figure>

2\) Vaya a En esta hoja de cálculo.

<figure><img src="/files/shHYTrSFnsgph01vwEya" alt="" width="375"><figcaption></figcaption></figure>

3\) Seleccione la pestaña de datos conectados de Arcwise que desea modificar.

<figure><img src="/files/f4KcNabvxOp1dZkBgQEP" alt="" width="375"><figcaption></figcaption></figure>
{% endtab %}
{% endtabs %}


# Agregar Columnas

Puede agregar una cantidad arbitraria de columnas adicionales a cualquier pestaña de datos conectada a Arcwise. Estas columnas se definen mediante fórmulas de hoja de cálculo que son idénticas a las fórmulas de Google Sheets. Para filtrar datos, navegue hasta la interfaz de datos conectados de Arcwise [Datos Conectados de Arcwise](/espanol/usando-arcwise-en-google-sheets/datos-conectados-de-arcwise).

{% hint style="info" %}
Arcwise proporciona sugerencias de IA para fórmulas de columnas. Si le da a su columna un nombre significativo (por ejemplo, número\_mes), Arcwise generalmente proporcionará una sugerencia que calcula el valor que necesita.
{% endhint %}

Arcwise admite la mayoría de las fórmulas. Para ver una lista completa consulte: [Fórmulas Admitidas](/espanol/usando-arcwise-en-google-sheets/formulas-admitidas)

1\) Haga clic en el botón de fórmula (Σ) en la sección Campos.

<figure><img src="/files/X1CmwujCK6Ck03jr4hq2" alt="" width="375"><figcaption></figcaption></figure>

2\) Dale a tu columna un nombre significativo. No se permiten espacios, comillas ni caracteres especiales.

<figure><img src="/files/xpy0FeAhGQ5dvjBXIp51" alt="" width="375"><figcaption></figcaption></figure>

3\) Arcwise AI dará una sugerencia en el cuadro azul. Si esta sugerencia parece correcta, puede aceptarla haciendo clic en el cuadro Fórmula y presionando Tab. Si la sugerencia no es correcta, puede ingresar su propia fórmula para definir la nueva columna.

4\) Después de agregar la columna, verá un nuevo campo con el nombre de su columna en verde. Puede editar o eliminar esta columna más tarde. Haga clic en el botón verde Actualizar consulta en la esquina inferior izquierda para agregar su nueva columna a los datos.

<figure><img src="/files/eN4Jw3M3yBWlSS3GxDRZ" alt="" width="375"><figcaption></figcaption></figure>


# Filtración

Puede agregar una cantidad arbitraria de filtros a cualquier pestaña de datos conectada a Arcwise. Para filtrar datos, navegue hasta la interfaz de datos conectados de Arcwise [Datos Conectados de Arcwise](/espanol/usando-arcwise-en-google-sheets/datos-conectados-de-arcwise).

1\) Haga clic en el botón más en la sección Filtros.

<figure><img src="/files/X1CmwujCK6Ck03jr4hq2" alt="" width="375"><figcaption></figcaption></figure>

2\) Seleccione la columna que desea filtrar, el tipo de comparación que desea agregar y los valores que desea incluir en el filtro. Para valores múltiples, presione Intro después de ingresar cada valor. Los valores deben ser exactos y no se validan con los datos.

<figure><img src="/files/tCYEMmklUZ3rVgP6gXd2" alt="" width="375"><figcaption></figcaption></figure>

3\) Haga clic en el botón verde Actualizar consulta en la esquina inferior izquierda para aplicar su filtro.


# Clasificación

Puede ordenar los datos en cualquier pestaña de datos conectada a Arcwise. Puede ordenar en varias columnas, donde las columnas anteriores tienen prioridad en el orden. Para ordenar datos, navegue hasta la interfaz de datos conectados de Arcwise [Datos Conectados de Arcwise](/espanol/usando-arcwise-en-google-sheets/datos-conectados-de-arcwise).

1\) Haga clic en el botón más en la sección Ordenar.

<figure><img src="/files/X1CmwujCK6Ck03jr4hq2" alt="" width="375"><figcaption></figcaption></figure>

2\) Seleccione la columna que desea ordenar. Si desea ordenar en varias columnas, haga clic en Agregar columna de clasificación. Puede agregar tantas columnas como desee aquí, aunque el rendimiento disminuirá con muchas clasificaciones en conjuntos de datos grandes (>100 000 filas).

<figure><img src="/files/h8m0vFa0z7kqwpHYAEOt" alt="" width="375"><figcaption></figcaption></figure>

3\) Haga clic en el botón verde Actualizar consulta en la esquina inferior izquierda para aplicar su clasificación.


# Trabajar con Grandes Datos

Las pestañas de datos conectadas en forma de arco pueden tener millones, o incluso miles de millones, de filas. Si realizaste el proceso en [Conectando Datos](/espanol/conectando-datos/conectando-datos)y el resultado tenía más de 200.000 celdas, entonces su pestaña de datos conectados a Arcwise solo mostrará 100 filas. Estos datos son una vista previa.

Puede trabajar con datos de gran tamaño casi de la misma manera que con datos normales. Puede utilizar todas las funciones disponibles para las pestañas de datos conectados de Arcwise. Ver [Descripción General](/espanol/configuracion-de-arcwise/integraciones/descripcion-general).

{% content-ref url="/pages/4MhQxTzyKlRbRAcB4q71" %}
[Agregar Columnas](/espanol/usando-arcwise-en-google-sheets/datos-conectados-de-arcwise/agregar-columnas)
{% endcontent-ref %}

{% content-ref url="/pages/3SeHnU1cK8FnIjrpBYA2" %}
[Filtración](/espanol/usando-arcwise-en-google-sheets/datos-conectados-de-arcwise/filtracion)
{% endcontent-ref %}

{% content-ref url="/pages/oVn4IxVynBRvtOhNB3t3" %}
[Clasificación](/espanol/usando-arcwise-en-google-sheets/datos-conectados-de-arcwise/clasificacion)
{% endcontent-ref %}

{% content-ref url="/pages/T67I8XOJ4viF4Fqykr81" %}
[Tablas Dinamicas](/espanol/usando-arcwise-en-google-sheets/tablas-dinamicas)
{% endcontent-ref %}

{% content-ref url="/pages/qq49bpFdPmAWobFw4QrR" %}
[Crear Visualizaciones Manuales](/espanol/usando-arcwise-en-google-sheets/crear-visualizaciones-manuales)
{% endcontent-ref %}

## Sugerencias para trabajar con big data

{% hint style="info" %}
La forma más sencilla de trabajar con grandes datos de Arcwise es utilizar el analista de IA. El analista de IA funciona especialmente bien cuando sus datos son grandes.
{% endhint %}

Cuando trabaja con datos de gran tamaño, solo puede ver una vista previa de 100 filas en la hoja. Es útil agregar clasificación y filtros para observar diferentes valores de los datos. Además, puede aplicar tablas dinámicas para agregar los datos y hacerlos lo suficientemente pequeños como para caber en una pestaña de hoja de cálculo estándar.


# Usar Fórmulas en Hojas

### Escribir fórmulas en arco

Las fórmulas de hoja de cálculo que hacen referencia a tablas de Arcwise se ejecutarán automáticamente en el conjunto de datos completo de la base de datos. Si hace referencia a una columna desde una pestaña de hoja de Arcwise, debería ver aparecer un icono de Arcwise en la barra de fórmulas:

<figure><img src="/files/4VjEc091jdRPbmtNPcE4" alt="" width="335"><figcaption></figcaption></figure>

Las fórmulas de Arcwise se ejecutan en su base de datos; Debería ver un breve mensaje "Cargando" mientras se ejecuta la fórmula y aparece el valor final.

{% hint style="info" %}
Las pestañas de datos conectados de Arcwise solo mostrarán una vista previa de 100 filas si los datos son muy grandes. Las fórmulas en las pestañas de datos conectados de Arcwise se ejecutarán en todo el conjunto de datos independientemente de si solo se muestra una vista previa en la hoja.
{% endhint %}

{% content-ref url="/pages/tM83Hk1ckIMZrqU1kxrt" %}
[Fórmulas Admitidas](/espanol/usando-arcwise-en-google-sheets/formulas-admitidas)
{% endcontent-ref %}

### Fórmulas Arcwise "refrescantes"

A diferencia de las fórmulas de hojas de cálculo normales, las fórmulas que hacen referencia a datos de Arcwise no se volverán a calcular automáticamente si sus entradas cambian.

<figure><img src="/files/vCym9R2siZ6nrUwjQWIt" alt=""><figcaption></figcaption></figure>

Cuando sea necesario actualizar una celda, cambiará a un fondo azul claro y su valor aparecerá como #N/A. Puede actualizar estas fórmulas con el botón de actualización en línea que se muestra (atajo de teclado: Cmd + E en MacOS o Alt + E en Windows. ¡"E" es para "Ejecutar"!)

{% hint style="info" %}
También puede ver valores #N/A al copiar/pegar o autocompletar fórmulas Arcwise en otras celdas. Al actualizar las celdas, estas se llenarán con valores reales.
{% endhint %}

También puedes actualizar las celdas usando la extensión de Chrome. Primero haga clic en el botón de fórmula en la esquina superior derecha.

<figure><img src="/files/rqr5DQQLLyZlB7uUPP84" alt="" width="375"><figcaption></figcaption></figure>

Luego seleccione el botón apropiado para actualizar las fórmulas que le interesan.

<figure><img src="/files/xJQXH4ZQpbeCt3ZlKTn5" alt="" width="375"><figcaption></figcaption></figure>


# Fórmulas Admitidas

Arcwise le permite utilizar casi todas las fórmulas en datos arbitrariamente grandes. Las fórmulas se pueden utilizar directamente en datos conectados a Arcwise: [Agregar Columnas](/espanol/usando-arcwise-en-google-sheets/datos-conectados-de-arcwise/agregar-columnas). Las fórmulas también se pueden utilizar en Google Sheet.

{% hint style="info" %}
Para hacer referencia a otras columnas en fórmulas, puede utilizar el nombre de la columna (por ejemplo, fecha\_envío) o la notación A:A, B:B estilo hoja de cálculo. Al hacer clic en las columnas mientras el editor de fórmulas está abierto, se insertará automáticamente una referencia a la columna en el editor.
{% endhint %}

Examples formulas:

* `MONTH(created_date)` extraerá el mes de una columna de fecha
* `MID(name, FIND(" ", name), LEN(name))` extraería el apellido de una columna de cadena que contiene nombres completos (por ejemplo, "Nombre Apellido")

## Column Formulas and Operators

Los campos de fórmula admiten un subconjunto limitado de funciones de hoja de cálculo. Estos se traducirán automáticamente a su equivalente SQL. También se admiten operadores aritméticos estándar (+, -, /, \*, ^).

**Funciones lógicas**

* `AND(x, y)`
* `IF(logical_expression, value_if_true, value_if_false)`
* `IFNA(value, value_if_na)`
  * NOTA: esto en realidad compara los valores NULL en la base de datos
  * **Advertencia: IFERROR** no es compatible actualmente. Para el caso de uso común de "detectar errores de división por cero", puedes usar: DIV0(a, b) en Snowflake y SAFE\_DIVIDE(a, b) en BigQuery, lo que dará como resultado un valor NULL (vacío) en lugar de un error. .
* `NOT(x)`
* `OR(x, y)`

**Funciones de cadena**

* `DATEVALUE(string)`
* `FIND(needle, haystack, [starting_position = 1])`
* `LEFT(string, number_of_characters)`
* `LEN(string)`
* `LOWER(string)`
* `INT(string)`
  * Converts a string to an integer (rounding to the nearest integer)
* `MID(string, starting_at, extract_length)`
* `REGEXEXTRACT(text, regular_expression)`
  * NOTA: La función REGEXEXTRACT de Google Sheets completará varias columnas con múltiples grupos de coincidencias. Nuestra implementación siempre devolverá la parte coincidente completa del tema. Los diferentes tipos de almacenes (Snowflake, Bigquery, PostgreSQL) tienen cada uno sus propias implementaciones de REGEX. Al escribir REGEX, espere el comportamiento específico del almacén al que están conectados sus datos, ya que ejecutamos su REGEX sin ningún procesamiento en ese almacén de datos.
* `RIGHT(string, number_of_characters)`
* `TRIM(string)`
* `UPPER(string)`
* Concatenación de cadenas: ambas `&` y `CONCATENATE(string1, [string2, ...])`

**Funciones numéricas**

* `INT(value)`
* `MAX(value1, [value2, ...])`
* `MIN(value1, [value2, ...])`
* `RAND()`
* `RANDBETWEEN(low, high)`
* `ROUND(value, [places])`
* `ROUNDDOWN(value, [places])`
* `ROUNDUP(value, [places])`
* `VALUE(val)`
  * Convierte un valor (normalmente una cadena) en un valor numérico.
* Funciones matemáticas estándar: ABS, ACOS, ASIN, ATAN, COS, COT, DEGREES, EXP, FLOOR, LN, LOG, LOG10, MOD, PI, POWER, RADIANS, SIGN, SIN, SQRT, TAN

**Funciones de fecha**

* `DATEDIF(date1, date2)`
* `DATEVALUE(string)`
* `DAY(date)`
* `EOMONTH(date)`
* `EDATE(date, number_of_months)`
* `MONTH(date)`
* `WEEKDAY(date)`
* `WEEKNUM(date)`
* `YEAR(date)`

**Uso avanzado: funciones de desplazamiento/ventana**

Puede resultar útil pasar directamente a los ejemplos (ver más abajo).

* `ROLLINGSUM(value)`
  * Calcula la suma móvil de un valor o columna (también requiere que se agregue un orden de clasificación en la pestaña).
* `ROLLINGSUMBY(value, group_column1, [group_column2, ...])`
  * Calcula la suma continua de una columna en todas las filas con el mismo grupo\_columna1, grupo\_columna2, etc.
* `ROLLINGMIN(value)` & `ROLLINGMINBY(value, group...)`
  * Calcula el mínimo rodante de una columna (misma sintaxis que la anterior)
* `ROLLINGMAX(value)` & `ROLLINGMAXBY(value, group, ...)`
  * Calcula el máximo rodante de una columna (misma sintaxis que la anterior)
* `FILLDOWN(value)` & `FILLDOWNBY(value, group, ...)`
  * "Rellena" valores no vacíos/no NULL en una columna hacia abajo. En otras palabras, si el argumento del valor es actualmente NULL o está vacío, entonces tomaremos el valor anterior no vacío de la misma agrupación (si existe).

También tenemos versiones "no rodantes" de min/max/sum (`MINBY`, `MAXBY`, `SUMBY`) que calculan el mínimo/máximo/suma general en todas las filas dentro del mismo grupo.

**Ejemplos**

Esta tabla de ejemplo muestra el resultado de varios "cálculos sucesivos" diferentes utilizando columnas de valores y grupos hipotéticos. (suponiendo que la tabla ya esté ordenada).&#x20;

Proporcionar un grupo básicamente significa que todas las filas dentro de un determinado grupo (por ejemplo, el grupo "a" o el grupo "b") tendrán sus valores móviles calculados de forma independiente. Puede proporcionar varias columnas de grupo para refinar aún más la agrupación.

<table data-full-width="true"><thead><tr><th>value</th><th>group</th><th data-type="number">ROLLINGSUM(value)</th><th>ROLLINGMINBY(value, group)</th><th>FILLDOWNBY(value, group)</th><th data-type="number">SUMBY(value, group)</th></tr></thead><tbody><tr><td>1</td><td>a</td><td>1</td><td>1</td><td>1</td><td>3</td></tr><tr><td>(empty)</td><td>a</td><td>1</td><td>1</td><td>1</td><td>3</td></tr><tr><td>2</td><td>a</td><td>3</td><td>1</td><td>2</td><td>3</td></tr><tr><td>(empty)</td><td>b</td><td>3</td><td>(empty)</td><td>(empty)</td><td>4</td></tr><tr><td>4</td><td>b</td><td>7</td><td>4</td><td>4</td><td>4</td></tr><tr><td>(empty)</td><td>b</td><td>7</td><td>4</td><td>4</td><td>4</td></tr></tbody></table>

Si el valor está en la columna A y el grupo está en la columna B, estas son las fórmulas equivalentes de Google Sheets:

(Suponiendo que C2, D2, E2, F2 comiencen en $A2)

* `ROLLINGSUM(value)`
  * `C3 = $C2 + $A3` (arrastre hacia abajo)
* `SUMBY(value, group)`
  * `D3 = SUMIF($B2:$B, $B3, $A2:$A)`
* `ROLLINGMINBY(value, group)`
  * `E3 = IF($B3=$B2, MIN($E3, $E2), $E3)` (arrastre hacia abajo)
* `FILLDOWNBY(value, group)`
  * `F3 = IF($B3=$B2, IF($F3<>"", $F3, $F2), $F3)` (arrastre hacia abajo)

**Uso avanzado: funciones SQL**

Aunque no están documentadas oficialmente, la mayoría de las funciones SQL funcionarán dentro de los campos de fórmula de Arcwise. Consulta la documentación oficial de tu almacén.&#x20;

Funciones útiles que generalmente funcionan en todas las bases de datos (ADVERTENCIA: a menudo son DIFERENTES de las funciones de Google Sheets del mismo nombre).

* `REPLACE(source_string, search_string, replace_string)`
  * Ejemplo: `REPLACE("the quick fox", "quick", "slow")`&#x20;
* `REGEXP_REPLACE(subject, pattern, replacement)`
  * <https://docs.snowflake.com/en/sql-reference/functions/regexp_replace>
* `REGEXP_SUBSTR(subject, pattern[, position[, occurrence]])`
  * <https://docs.snowflake.com/en/sql-reference/functions/regexp_substr>

**Enlaces a referencias:**

* Snowflake functions: <https://docs.snowflake.com/en/sql-reference/intro-summary-operators-functions>
* BigQuery functions: <https://cloud.google.com/bigquery/docs/reference/standard-sql/functions-and-operators>

## Fórmulas de agregación

{% hint style="info" %}
Las fórmulas de agregación no se pueden utilizar para crear nuevas columnas en las pestañas de datos conectados de Arcwise: [Agregar Columnas](/espanol/usando-arcwise-en-google-sheets/datos-conectados-de-arcwise/agregar-columnas). Ellos se usan exclusivamente dentro de Google Sheets: [Usar Fórmulas en Hojas](/espanol/usando-arcwise-en-google-sheets/formulas).
{% endhint %}

* `COUNT` / `COUNTIF` / `COUNTIFS`
* `COUNTUNIQUE / COUNTUNIQUEIFS`
* `SUM` / `SUMIF` / `SUMIFS`
* `AVERAGE` / `AVERAGEIF` / `AVERAGEIFS`
* `MIN` / `MINA` / `MINIFS`
* `MAX` / `MAXA` / `MAXIFS`
* `MEDIAN` / `MODE`
* `COUNTA` / `ROWS`
  * NOTA: Independientemente de la columna pasada, siempre devolverán el número completo de filas en el conjunto de datos conectado.
* `LOOKUP` / `XLOOKUP`
  * Tanto BUSCAR como BUSCAR XL son iguales con Arcwise (y no requieren "datos ordenados"). Sin embargo, si hay varias coincidencias, una de ellas se seleccionará al azar.
  * Nota: por el momento, solo se admiten los primeros tres argumentos (clave\_búsqueda, rango\_búsqueda, rango\_resultados).
* `ARCFILTERIFS`
  * Un cruce entre el FILTRO de hojas y una función IFS (devolverá todas las filas coincidentes en la tabla, pero toma pares de criterios como CONTAR.SI/SUMAR.)
* `ARCUNIQUE`
  * Devuelve todos los valores únicos en una columna.
* `ARCQUERY`
  * Ejecuta SQL en línea. Consulte la sección siguiente sobre [#arcquery](#arcquery "mention").

NOTA: Las agregaciones numéricas como SUMA, PROMEDIO, MIN, MAX, etc. no funcionarán con columnas de cadena por el momento.

## Notas sobre funciones de criterios (\*IF / \*IFS)

* Para las columnas que no son cadenas en la base de datos, interpretamos el criterio de cadena vacía "" para contar el número de valores NULL. Por el contrario, "<>" contará el número de valores no nulos.
  * Ejemplo: `=COUNTIF(ARCTable!A:A, "")` contará el número de valores NULL en la columna A.
* Las columnas de fecha se pueden comparar con `YYYY/MM/DD, MM/DD/YYYY, YYYY-MM-DD, MM-DD-YYYY` criterios (o fechas de hojas de cálculo numéricas como 44322). Es posible que otros formatos no funcionen como se esperaba.

### ARCQUERY

Exponemos una fórmula especial, ARCQUERY, para permitir consultas SQL en línea en una celda de una hoja de cálculo. Sintácticamente, los primeros argumentos deben ser columnas de tablas Arcwise y el segundo argumento debe ser una consulta SQL. En la consulta SQL, utilice el nombre de la hoja de origen en minúsculas para hacer referencia a la tabla de origen de Arcwise. Ejemplo:

```cpp
=ARCQUERY(ArcTable!$A:$A, "SELECT * FROM arctable LIMIT 10")
```

Puede pasar columnas de varias hojas de Arcwise y consultarlas todas a la vez:

```cpp
=ARCQUERY(ArcTable!$A:$A, Sheet2!$B:$B, "SELECT * FROM arctable JOIN sheet2
 ON arctable.id = sheet2.id")
```

> Nota: Es posible que sea necesario citar las hojas con espacios u otros caracteres no alfanuméricos. Normalmente esto significa que el nombre de la tabla será, por ejemplo. "hoja 1" (si estás en BigQuery, usa comillas invertidas: "hoja 1"). Tenga en cuenta que las comillas dobles deben ir acompañadas de dos comillas dobles:
>
> `=ARCQUERY('Sheet 1'!$A:$A, "SELECT * FROM ""sheet 1""")`

## Limitaciones conocidas

Cuando se utilizan columnas Arcwise, las siguientes funciones no son compatibles actualmente (a partir de julio de 2023). ¡Contáctenos si tiene un caso de uso que los requiera!

* `ARRAYFORMULA` (y usando literales de matriz como {1,2,3} en general)
* `ROW` / `COLUMN` / `INDIRECT`
* `LET` / `LAMBDA`


# Tablas Dinamicas

Arcwise admite pivotes en pestañas de datos. Para crear un pivote, siga los pasos a continuación.

1\) Navega hasta el [Datos Conectados de Arcwise](/espanol/usando-arcwise-en-google-sheets/datos-conectados-de-arcwise) pestaña en la que le gustaría hacer un pivote.

<figure><img src="/files/PI7OFwvs7YN62G8jF9rL" alt="" width="375"><figcaption></figcaption></figure>

2\) En el menú Agregar siguiente paso en la esquina inferior izquierda, seleccione Agregar transformación dinámica.

<figure><img src="/files/nP9tv4ttteRRVeIcDQNp" alt="" width="375"><figcaption></figcaption></figure>

3\) Agregue los filtros, columnas, filas y valores que desee en el pivote y obtenga una vista previa del resultado

<figure><img src="/files/SCkhxXslOMnCxfmDsCvv" alt=""><figcaption></figcaption></figure>

4\) Cuando el resultado parezca correcto, haga clic en el botón verde Conectar en la esquina inferior derecha.

## Fórmulas y agregaciones admitidas

De manera similar a las fórmulas a nivel de columna, para los pivotes admitimos un subconjunto de las funciones integradas de Hojas de cálculo y las expresiones aritméticas más comunes. También puede utilizar funciones SQL.

**Lista de funciones admitidas oficialmente**

* **Aggregation functions**
  * SUM
  * COUNT, COUNTUNIQUE
  * AVERAGE
  * MIN, MAX
  * MEDIAN, MODE
  * STDEV, STDEVP
  * VAR, VARP
  * CORREL
  * COVAR, COVARIANCE.P
* **Funciones matemáticas:** ACOS ASIN ATAN COS COT DEGREES EXP FLOOR LEFT LEN LN LOG LOG10 LOWER MOD PI POWER RADIANS REGEXEXTRACT RIGHT SIGN SIN SQRT TAN TRIM UPPER

**Ejemplos**

* Suponiendo que su tabla tiene columnas de costo y cantidad, la fórmula `SUM(cost) / SUM(quantity)`daría como resultado el costo promedio por artículo.
* O si tienes una tabla de pedidos con precio y cantidad,`AVERAGE(price * quantity)` le daría el tamaño promedio de los pedidos.


# Crear Visualizaciones Manuales

{% hint style="warning" %}
Las visualizaciones sólo se pueden crear a partir de una tabla con la estructura adecuada. A menudo, esto significa que no se puede crear una visualización a partir de datos sin procesar. Típicamente [Tablas Dinamicas](/espanol/usando-arcwise-en-google-sheets/tablas-dinamicas) son necesarios para preparar los datos para su visualización.
{% endhint %}

Para crear una visualización, utilice los siguientes pasos.

1\) En una pestaña de datos conectados de Arcwise con una estructura adecuada, navegue hasta la vista de la pestaña de datos conectados de Arcwise: [Datos Conectados de Arcwise](/espanol/usando-arcwise-en-google-sheets/datos-conectados-de-arcwise).

<figure><img src="/files/HEvhwPxxyfZGpeB8mU3L" alt="" width="375"><figcaption></figcaption></figure>

2\) En la parte superior de la sección Próximos pasos, haga clic en el icono de visualización y seleccione Visualización Arcwise.

<figure><img src="/files/NNFubWhirEyffXNdEiZo" alt="" width="375"><figcaption></figcaption></figure>

3\) Configure la visualización como le gustaría usar la interfaz.

<figure><img src="/files/I1TgI9T36OFJinHKP83w" alt=""><figcaption></figcaption></figure>

4\) Haga clic en el botón verde Guardar en la parte inferior derecha para guardar la visualización en su hoja.


# Descripción General del Analista IA

El analista de Arcwise AI se puede utilizar para una amplia gama de tareas: recuperación de datos, creación de métricas comerciales, creación de visualizaciones y generación de información que se puede copiar en informes. Puede ver ejemplos de indicaciones y uso en las secciones siguientes.

{% content-ref url="/pages/pb5PTYOmLS1gD8eLKCHo" %}
[Obtener Datos Usando IA](/espanol/usando-arcwise-ia/obtener-datos-usando-ia)
{% endcontent-ref %}

{% content-ref url="/pages/VkQi1iZJZWmeTfXGaJ06" %}
[Creando un Visual](/espanol/usando-arcwise-ia/creando-un-visual)
{% endcontent-ref %}

{% content-ref url="/pages/6sRDxNrddGG2GcAjC6LY" %}
[Generando una Visión](/espanol/usando-arcwise-ia/generando-una-vision)
{% endcontent-ref %}

El analista de Arcwise AI puede trabajar con cualquier dato conectado a Arcwise. Esto incluye:

* Datos de su almacén de datos (NO es necesario importarlos a la hoja)
* CSV importados como pestañas de datos conectadas a Arcwise (método de importación preferido)
* Datos de sus herramientas conectadas (por ejemplo: Salesforce, NetSuite)
* Informes y vistas de sus herramientas conectadas importadas como pestañas de datos conectados de Arcwise

El analista de Arcwise AI también puede operar con datos de su hoja de cálculo que no sean una pestaña de datos conectada a Arcwise.

{% content-ref url="/pages/U0uo6OAsjgQ2KgAoUqdV" %}
[Uso de IA en Datos de Hojas de Cálculo](/espanol/usando-arcwise-ia/uso-de-ia-en-datos-de-hojas-de-calculo)
{% endcontent-ref %}

{% hint style="warning" %}
Arcwise AI es más eficaz con datos conectados a Arcwise. Si tiene datos en su hoja de cálculo, es preferible conectarlos como una pestaña de datos conectada a Arcwise. Esto se puede hacer manualmente para todas las fuentes, incluidos los CSV: [Conectando Datos](/espanol/conectando-datos/conectando-datos).

Si sus datos se originaron en un almacén de datos, la forma más fácil de obtenerlos es con IA: [Obtener Datos Usando IA](/espanol/usando-arcwise-ia/obtener-datos-usando-ia). Esto crea automáticamente una pestaña de datos conectados a Arcwise.
{% endhint %}


# Obtener Datos Usando IA

Hay varias formas en que se puede utilizar Arcwise AI para recuperar datos. A continuación se muestran algunos ejemplos de indicaciones, así como instrucciones para guardarlo en la hoja.

## Indicaciones de ejemplo

> Consígueme una tabla de todas las transacciones del año pasado.

Este mensaje se puede ejecutar desde una hoja en blanco y recuperará una tabla de transacciones de su almacén de datos u otra fuente de datos conectada. Podrían ser millones de filas, pero aún podrá guardarlas en la hoja y trabajar con los datos, tanto con herramientas de hojas de cálculo normales como con IA: [Trabajar con Grandes Datos](/espanol/usando-arcwise-en-google-sheets/trabajar-con-grandes-datos).

> Consígueme una lista de nuestras tiendas, las ventas totales en esas tiendas el año pasado y el cambio interanual en las ventas.

Este mensaje se puede ejecutar desde una hoja en blanco y recuperará una tabla de transacciones de su almacén de datos u otra fuente de datos conectada. También se puede ejecutar después de conectar manualmente la fuente de datos correcta: [Conectando Datos](/espanol/conectando-datos/conectando-datos). Es probable que estos datos sean pequeños.

{% hint style="warning" %}
Si Arcwise está conectado a su almacén de datos, puede recuperar tablas de una hoja vacía. Si Arcwise no está conectado a su almacén de datos, o su administrador no le ha dado acceso a la IA al almacén de datos, entonces debe agregar tablas usando los flujos tradicionales: [Conectando Datos](/espanol/conectando-datos/conectando-datos).
{% endhint %}

## Guardar datos en la hoja

Después de pedirle datos al analista de IA, puede guardarlos en la hoja con el botón Guardar.

<figure><img src="/files/bcbzXGHoevuaFQNfsaAk" alt="" width="375"><figcaption></figcaption></figure>


# Creando un Visual

El analista de Arcwise AI tiene la capacidad de crear imágenes. En el proceso de creación de un objeto visual, se producirá una consulta que recopila datos y luego visualiza los datos resultantes.

## Indicaciones de ejemplo

> Muéstrame clientes potenciales a lo largo del tiempo por mes y fuente de clientes potenciales.

Este mensaje se puede ejecutar desde una hoja en blanco o desde una hoja con alguna pestaña llamada leads. Recuperará una tabla con el mes, la fuente de clientes potenciales y el recuento de clientes potenciales. Luego producirá una visualización de estos datos.

## Guardar imágenes en la hoja

Una vez creado un objeto visual, se puede guardar en la hoja con el botón azul Guardar. También se puede editar antes de guardarlo en la hoja usando el botón Editar. La visualización se puede volver a editar una vez que esté en la hoja.

<figure><img src="/files/u9zdzBfVlY2GPlHrLTYr" alt="" width="375"><figcaption></figcaption></figure>


# Generando una Visión

El analista de Arcwise AI está diseñado exclusivamente para generar información basada en datos. Las ideas pueden ayudar a responder preguntas como:

* ¿Por qué hubo un aumento en las ventas en julio?
* ¿Por qué se retrasaron los envíos ayer?
* ¿Qué factores llevaron al aumento de las entradas la semana pasada?

Arcwise puede ayudar a realizar el análisis para que el usuario pueda obtener respuestas. Arcwise no tiene todo el contexto empresarial y no puede sacar conclusiones, pero puede buscar posibles causas en los datos a los que tiene acceso.

{% hint style="warning" %}
Arcwise es más capaz de generar conocimientos una vez que la información se ha agregado al contexto de la IA. Sin un contexto empresarial específico, la IA estará menos enfocada y es posible que no tenga la información adecuada para llegar a un análisis de la causa raíz.
{% endhint %}

{% hint style="warning" %}
Arcwise solo puede aprovechar los datos a los que tiene acceso. Esto puede incluir o no datos en su almacén de datos. Pregúntele a su administrador a qué tiene acceso Arcwise.&#x20;

Para garantizar que Arcwise tenga acceso a algún dato específico, siempre puede conectarlo a la hoja: [Conectando Datos](/espanol/conectando-datos/conectando-datos).
{% endhint %}

## Caso de estudio

Comenzamos con un conjunto de datos de Salesforce que contiene todas nuestras ofertas. Queremos realizar un seguimiento del valor total de los acuerdos cerrados a lo largo del tiempo. Podemos obtener esta información del analista de IA.

> muéstreme el tamaño total de la oferta a lo largo del tiempo por mes para 2022

<figure><img src="/files/3Gc9Rkplj9wAoI1rFW6D" alt="" width="375"><figcaption></figcaption></figure>

Vemos que hay un pico muy grande en julio y ahora nos gustaría saber por qué. Aquí es donde necesitamos generar algún tipo de información sobre lo que ocurrió en julio. Podemos pedir alguna idea.

> explicar el aumento en julio

Esto hará que la IA busque datos relevantes que puedan conducir a una explicación. En este caso, analiza 4 métricas relacionadas para ayudar a explicar la situación, visualiza esas métricas y proporciona un resumen de texto de los datos.

<figure><img src="/files/AMmlKB05omeWQVqOmB2q" alt="" width="375"><figcaption><p>Deal sizes were much larger for Direct Traffic</p></figcaption></figure>

<figure><img src="/files/HLkFgXnW4nqOjuzwLwaK" alt="" width="375"><figcaption><p>A summary of findings</p></figcaption></figure>

A partir de estos resultados podemos ver que hubo un tamaño de transacción mucho mayor para el tráfico directo y también que el tamaño promedio de la transacción fue mucho mayor. Podemos seguir haciendo preguntas para refinar aún más esta idea.


# Uso de IA en Datos de Hojas de Cálculo

Arcwise funciona mejor en pestañas de datos conectadas a Arcwise y datos de su almacén de datos: [Conectando Datos](/espanol/conectando-datos/conectando-datos). Sin embargo, Arcwise funciona con datos de hojas de cálculo normales.

Para trabajar con Arcwise en datos de hojas de cálculo, puede resaltar las celdas que le interesa analizar. Arcwise solo funcionará con datos que estén en forma tabular.

<figure><img src="/files/VBRAFQnAkMPERMbJCTgX" alt="" width="375"><figcaption></figcaption></figure>

Puede comenzar a trabajar con Arcwise en este rango haciendo clic en el pequeño ícono de Arcwise en la parte superior derecha de su selección.

También puede abrir la extensión Arcwise y seleccionar Analizar el rango seleccionado.

<figure><img src="/files/iqA6j4kCH7I88M6KU3Ei" alt="" width="375"><figcaption></figcaption></figure>

Puede verificar que Arcwise funcionará en esta selección marcando el área Enfocada en la parte superior y verificando que haga referencia al rango que seleccionó. El nombre del hilo inicial también hará referencia a las celdas seleccionadas, aunque el nombre del hilo se puede modificar más adelante.

<figure><img src="/files/sRy44fOOStkAXobJhYlO" alt="" width="375"><figcaption></figcaption></figure>